Writing
How to Build a Crypto Analytics Dashboard
Explore crypto and blockchain analytics dashboard development, including real-time data, wallet tracking, market insights, key features, technology, security, and development costs.
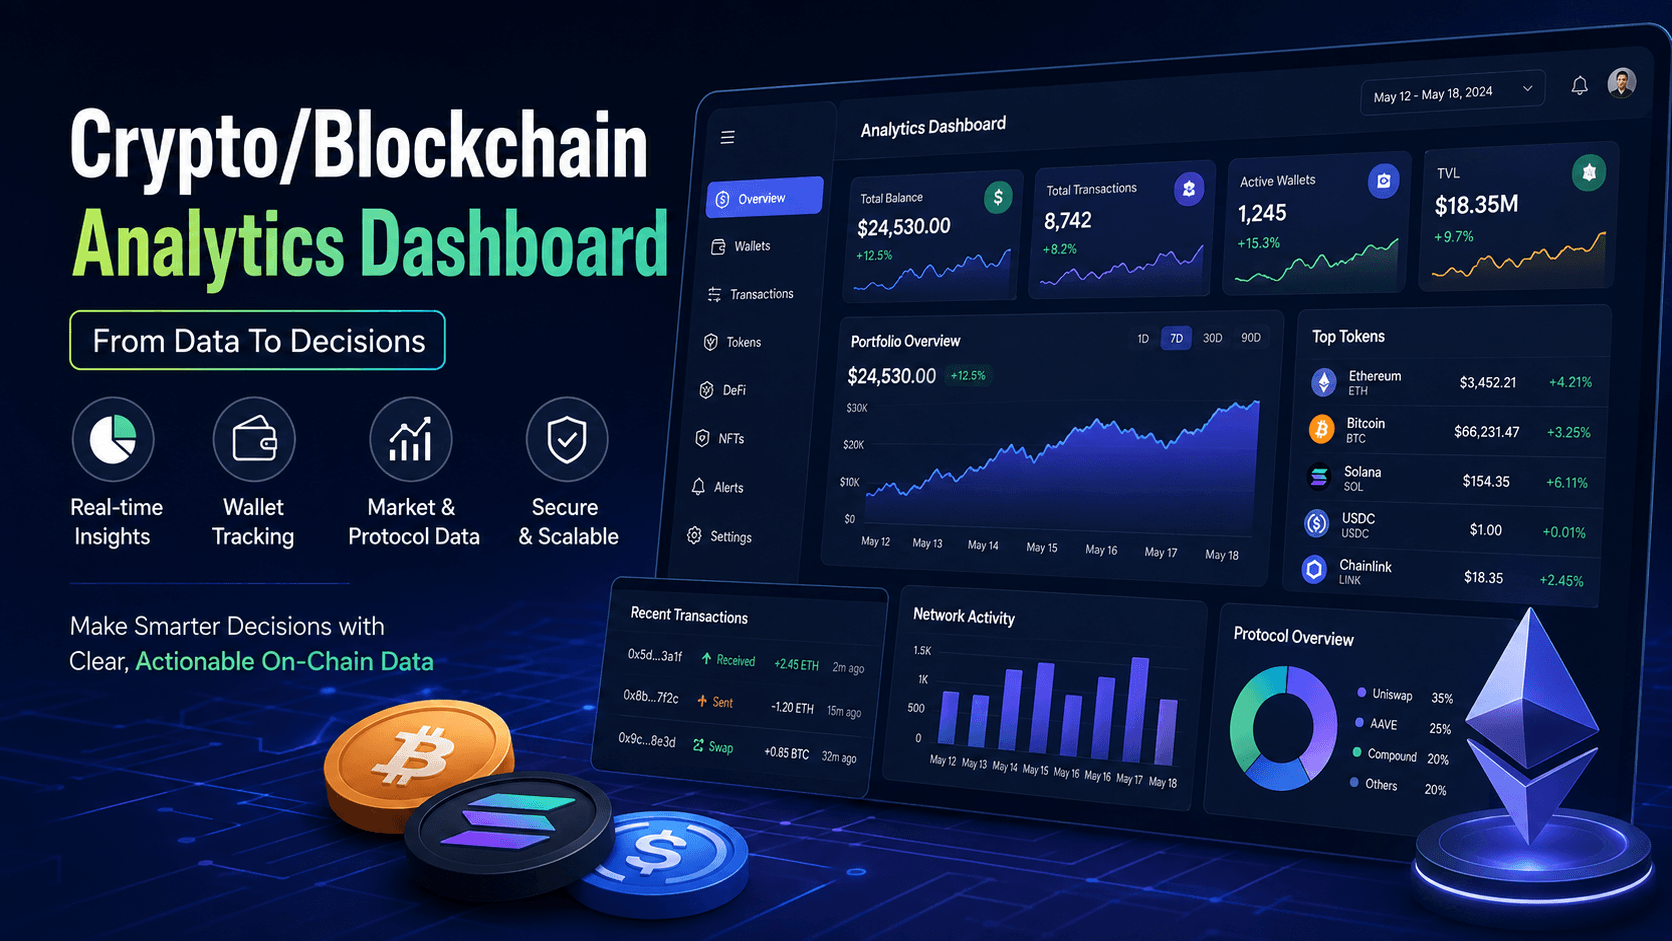
While there's plenty of blockchain data, there's not much that tells a team what to do next when it comes to raw transactions. Crypto/Blockchain Analytics Dashboard Development provides a single view of wallet activity, token movements, protocol metrics, and market information for focused analysis. The goal is to link helpful signals to decisions, not numbers to a screen.
What Is a Blockchain Analytics Dashboard?
A blockchain analytics dashboard is a web application that aggregates blockchain or market data and displays it via metrics, charts, filters and activity views. It can aggregate balances, transactions, tokens and protocol activity into a single interface.
For example, a product monitoring a smart wallet could combine wallet balances, transaction history, token holdings, and large transfers in one view. Khalil Ahmed's portfolio documents a DeFi dashboard that combines wallet balances, staking positions, and protocol data from multiple sources.
Which Metrics Should Your Dashboard Actually Track?
Start with the decision, then choose the metric. Wallet products may need balances and transfers, while DeFi products may need TVL, liquidity, staking positions, and protocol activity.
Market-focused dashboards can also compare assets, market capitalization, trading volume, and historical movement. A product using marketcapof-style market information, for instance, could turn those figures into searchable asset comparisons rather than leaving users to inspect separate pages.
The same principle applies to NFT products. Some of the most useful metrics that the best NFT marketplaces dashboard may contain are floor prices, volume, sales activity, collection performance and marketplace-level trends.
What Features Should a Crypto Analytics Dashboard Include?
Useful features should support a specific monitoring task. Common choices include searchable wallets, transaction feeds, historical charts, filters, alerts, exports, chain selectors, and responsive layouts.
A dashboard for best web3 wallets could compare balances, supported networks, activity, and token holdings. A gaming analytics product could instead track users, transactions, NFT activity, and asset movement across web3 games.
Khalil's portfolio also documents a multi-chain whale tracker using wallet activity, filtering, and near-real-time updates.
How Does a Blockchain Analytics Dashboard Get Its Data?
A dashboard can combine RPC calls, indexers, GraphQL services, market APIs, and application databases. The right combination depends on whether the screen needs contract reads, indexed history, wallet activity, or market prices.
TypeChain can be relevant in TypeScript-based Ethereum development because generated contract typings can provide stronger type information when interacting with smart contracts. For analytics products, typed contract interactions can reduce mistakes when reading specific blockchain data.
A separate question may involve Chainlink vs Quant. The technologies are different and a dashboard should first determine if it requires oracle data, interoperability, market information or another specific data source, before selecting an integration.
How Is a Real-Time Blockchain Analytics Dashboard Built?
A practical build starts with decisions and data. The workflow can follow these stages:
-
Define users, KPIs, chains, and update requirements.
-
Select data providers and confirm available fields.
-
Build ingestion, normalization, caching, and error handling.
-
Create predictable application endpoints.
-
Add charts, filters, loading states, and empty states.
-
Test stale responses, failures, wrong-network states, and large datasets.
-
Deploy and monitor API limits and data freshness.
Khalil's portfolio documents a whale-tracking dashboard using polling for near-real-time wallet activity. That means polling is a viable choice if not every event needs to have a persistent connection.
When Should You Build A Custom Analytics Dashboard?
Create custom when proprietary KPIs, permissions, workflows or integrations do not exist within an analytics platform. An established tool can be preferable when standard metrics already answer the user's questions.
The decision should begin with the gap. If a team repeatedly moves data from an analytics platform into its own product, a custom interface may remove that extra step.
The same logic can be used when designing an mlx dashboard or any other specific analytics interface: determine who will be using it, what data will be fed into it, and what decisions will be made with it before deciding on the architecture of the interface.
How Much Does Crypto/Blockchain Analytics Dashboard Development Cost?
Cost depends on scope. Network count, indexing requirements, historical data, live updates, authentication, analytics complexity, and interface depth can all change the development effort.
Khalil's published Web3 material discusses dashboard development costs in relation to project scope rather than treating every dashboard as identical. A small analytics interface with a few APIs is fundamentally different from a multi-chain platform requiring custom indexing and live monitoring.
Before requesting a fixed estimate, decide on the networks, screens, data sources, and update frequency for Crypto/Blockchain Analytics Dashboard Development.
How Do You Keep Blockchain Dashboard Data Accurate and Secure?
The accuracy is dependent on the freshness of the data, validation of responses, handling of failed requests, and clarity of source information. Security requires protected credentials, controlled access, input validation, and careful handling of wallet states.
Consider a dashboard showing a wallet's token balance. If its cached value is several minutes old while the interface presents it as current, users may make decisions from stale information. Timestamping, refetch rules, loading states, and error messages can make that limitation visible.
Khalil Ahmed's Web3 Dashboard Experience
Khalil Ahmed's portfolio documents a real-time crypto price dashboard, multi-chain whale tracker, wallet transaction analyzer, and DeFi portfolio dashboard.
Those projects cover several practical analytics patterns: market monitoring, wallet activity, transaction inspection, and portfolio tracking. The combination is relevant for products that need multiple blockchain data sources presented through one consistent interface.
FAQ
What Is An On-Chain Analytics Dashboard?
An on-chain analytics dashboard is a tool that presents blockchain activity in a readable way in terms of metrics and visualizations. It can monitor wallets, transfers, token movements, contracts or protocol activity without having to check each transaction on a case-by-case basis.
Can A Blockchain Dashboard Support A Smart Wallet?
Yes. A dashboard can monitor a smart wallet's balances, transactions, token holdings, network activity, and other relevant events when suitable blockchain data is available.
What Technology Can Support Blockchain Dashboards?
Common choices include Next.js, React, TypeScript, RPC providers, indexers, APIs, databases, caching systems, and charting libraries. TypeChain may also help with typed contract interactions in TypeScript projects.
Can A Dashboard Analyze Web3 Games?
Yes. A gaming dashboard can monitor users, transactions, NFTs, token activity, and marketplace interactions. The exact metrics depend on the game's contracts and available indexed data.
Can Dashboards Compare Nft Marketplaces?
Yes. An NFT analytics interface can compare marketplace volume, sales, floor prices, collections, and activity when reliable marketplace and blockchain data is available.
What Are The Best Web3 Wallets For Analytics Tracking?
There isn't one universal choice. A dashboard should evaluate the wallets and networks its users actually need to monitor, then select data providers that expose the required balances and transaction information.
Can A Dashboard Track Marketcapof-Style Data?
Yes. Market capitalization, trading volume, price history, and token supply can be incorporated when the selected market-data provider supplies those fields.
Is Chainlink Or Quant Better For A Blockchain Dashboard?
Neither is automatically better. The choice depends on the required function, such as oracle-related data or interoperability. The dashboard's data requirements should determine the integration.
What Is An Mlx Dashboard?
An MLX dashboard can refer to a specialized analytics interface or dashboard implementation, but the exact requirements depend on the product. Its metrics, data sources, and users should be defined before selecting an architecture.
Conclusion: The Best Dashboard Starts With A Decision
A good analytics tool should be built in reverse from the decision it is intended to inform. First, state the action, then choose the smallest reliable data set that addresses that action, and then determine which charts and integrations are on screen. That way, future features have a clear yardstick to measure themselves against: Does this aid the user in making a better decision, or is it just another number?