







Overview
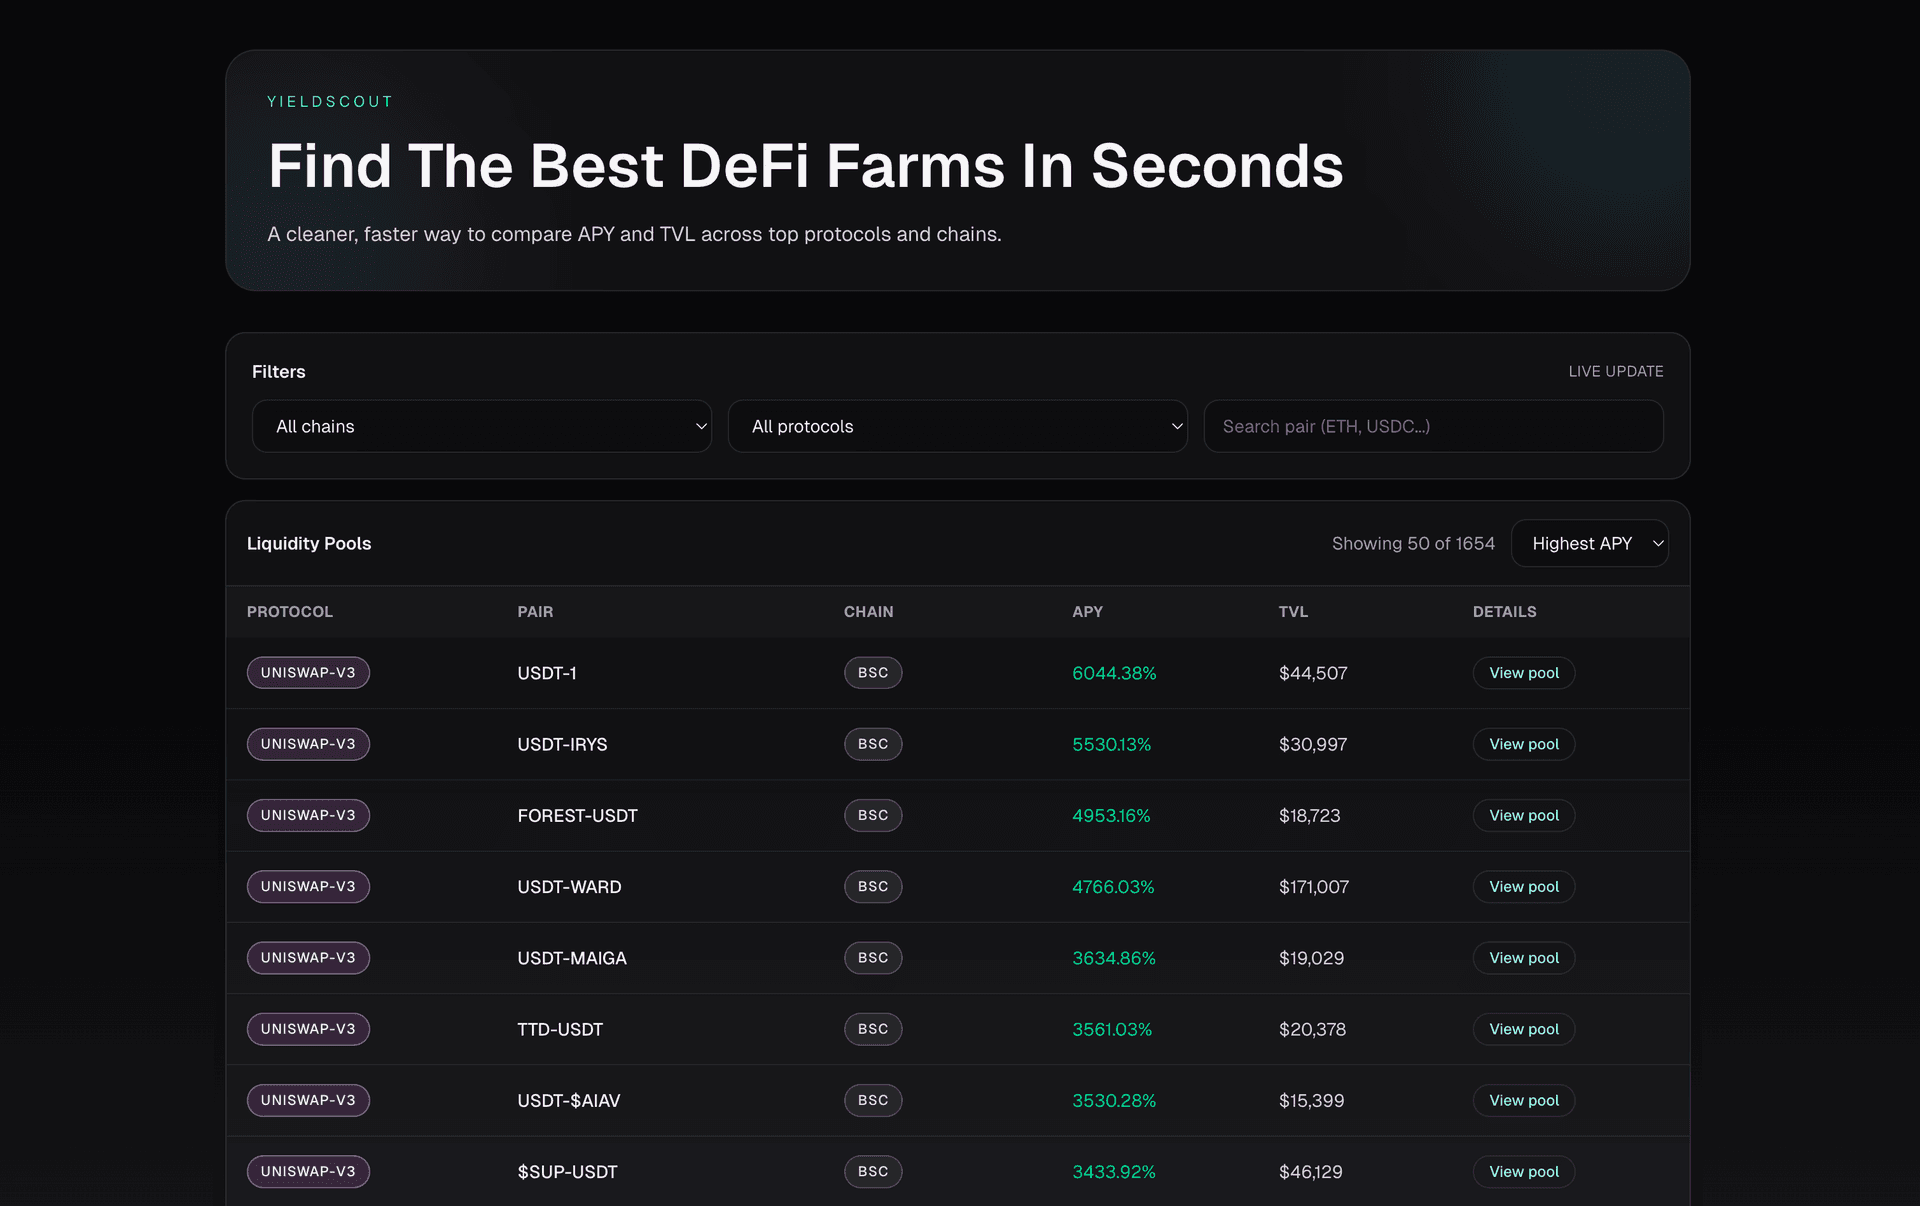
A DeFi analytics dashboard that aggregates yield data across protocols and chains with clear APY comparisons. Built with Next.js, TypeScript, Wagmi, RainbowKit, The Graph, and Tailwind CSS so users can compare opportunities without checking multiple platforms manually.
Problem
DeFi users compare yields across many protocols and chains manually, switching between multiple platforms to find the best APY opportunities.
Solution
Built a DeFi yield aggregator dashboard that surfaces APY comparisons across protocols and chains in one interface, powered by The Graph and wallet-connected reads.
My role
Sole frontend developer — dashboard UI, data visualization, wallet integration, and responsive layout.
Key features
- Cross-protocol and cross-chain yield comparison
- Wallet-connected reads with Wagmi and RainbowKit
- The Graph for on-chain yield data
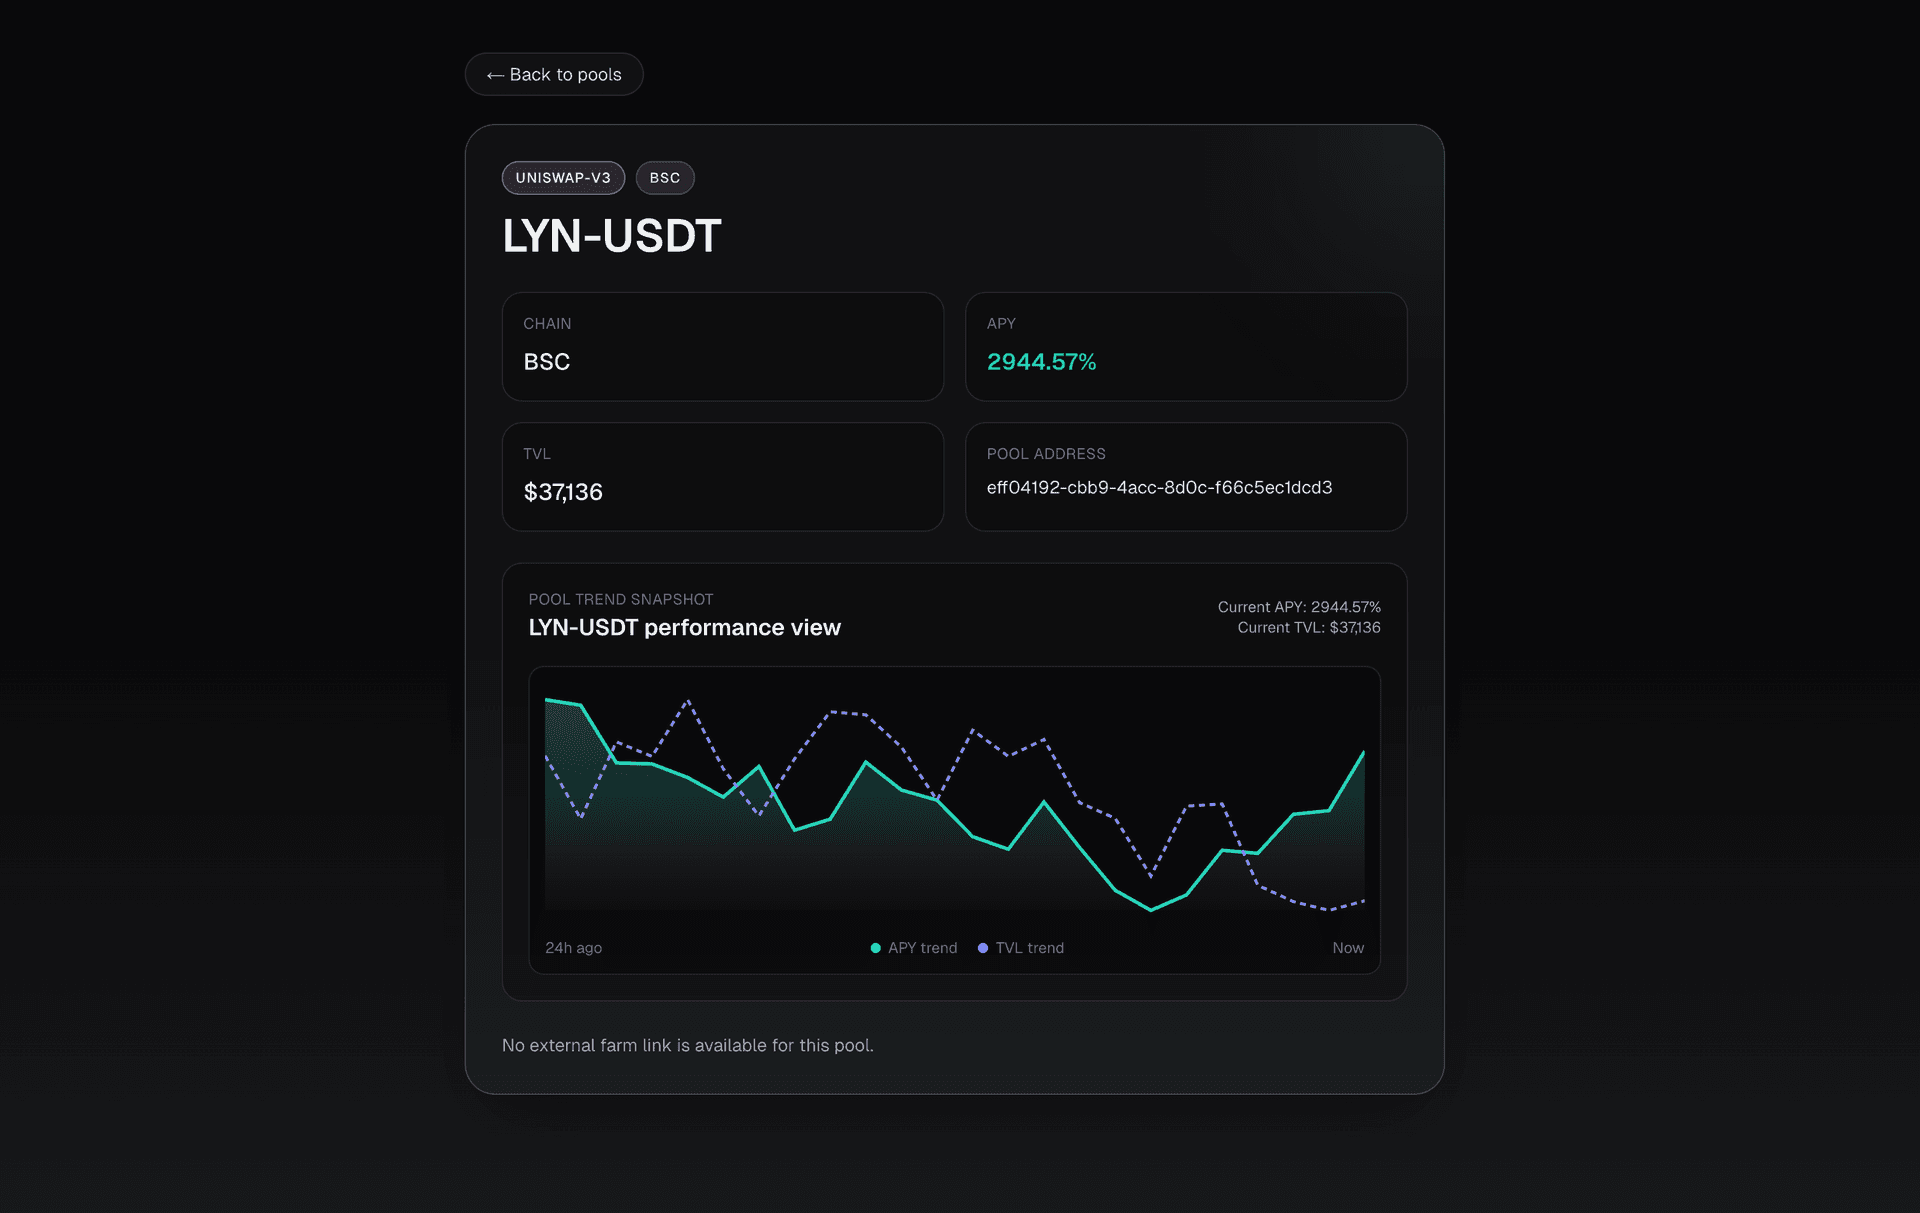
- Clean APY comparison tables and charts
- Responsive Tailwind CSS UI
Results & impact
Consolidates yield research into a single dashboard, making it faster for users to compare APY opportunities across protocols and chains.
Technology stack
- Wagmi
- RainbowKit
- The Graph
- TypeScript
Screenshots
Related projects
Production-ready Web3 dashboard
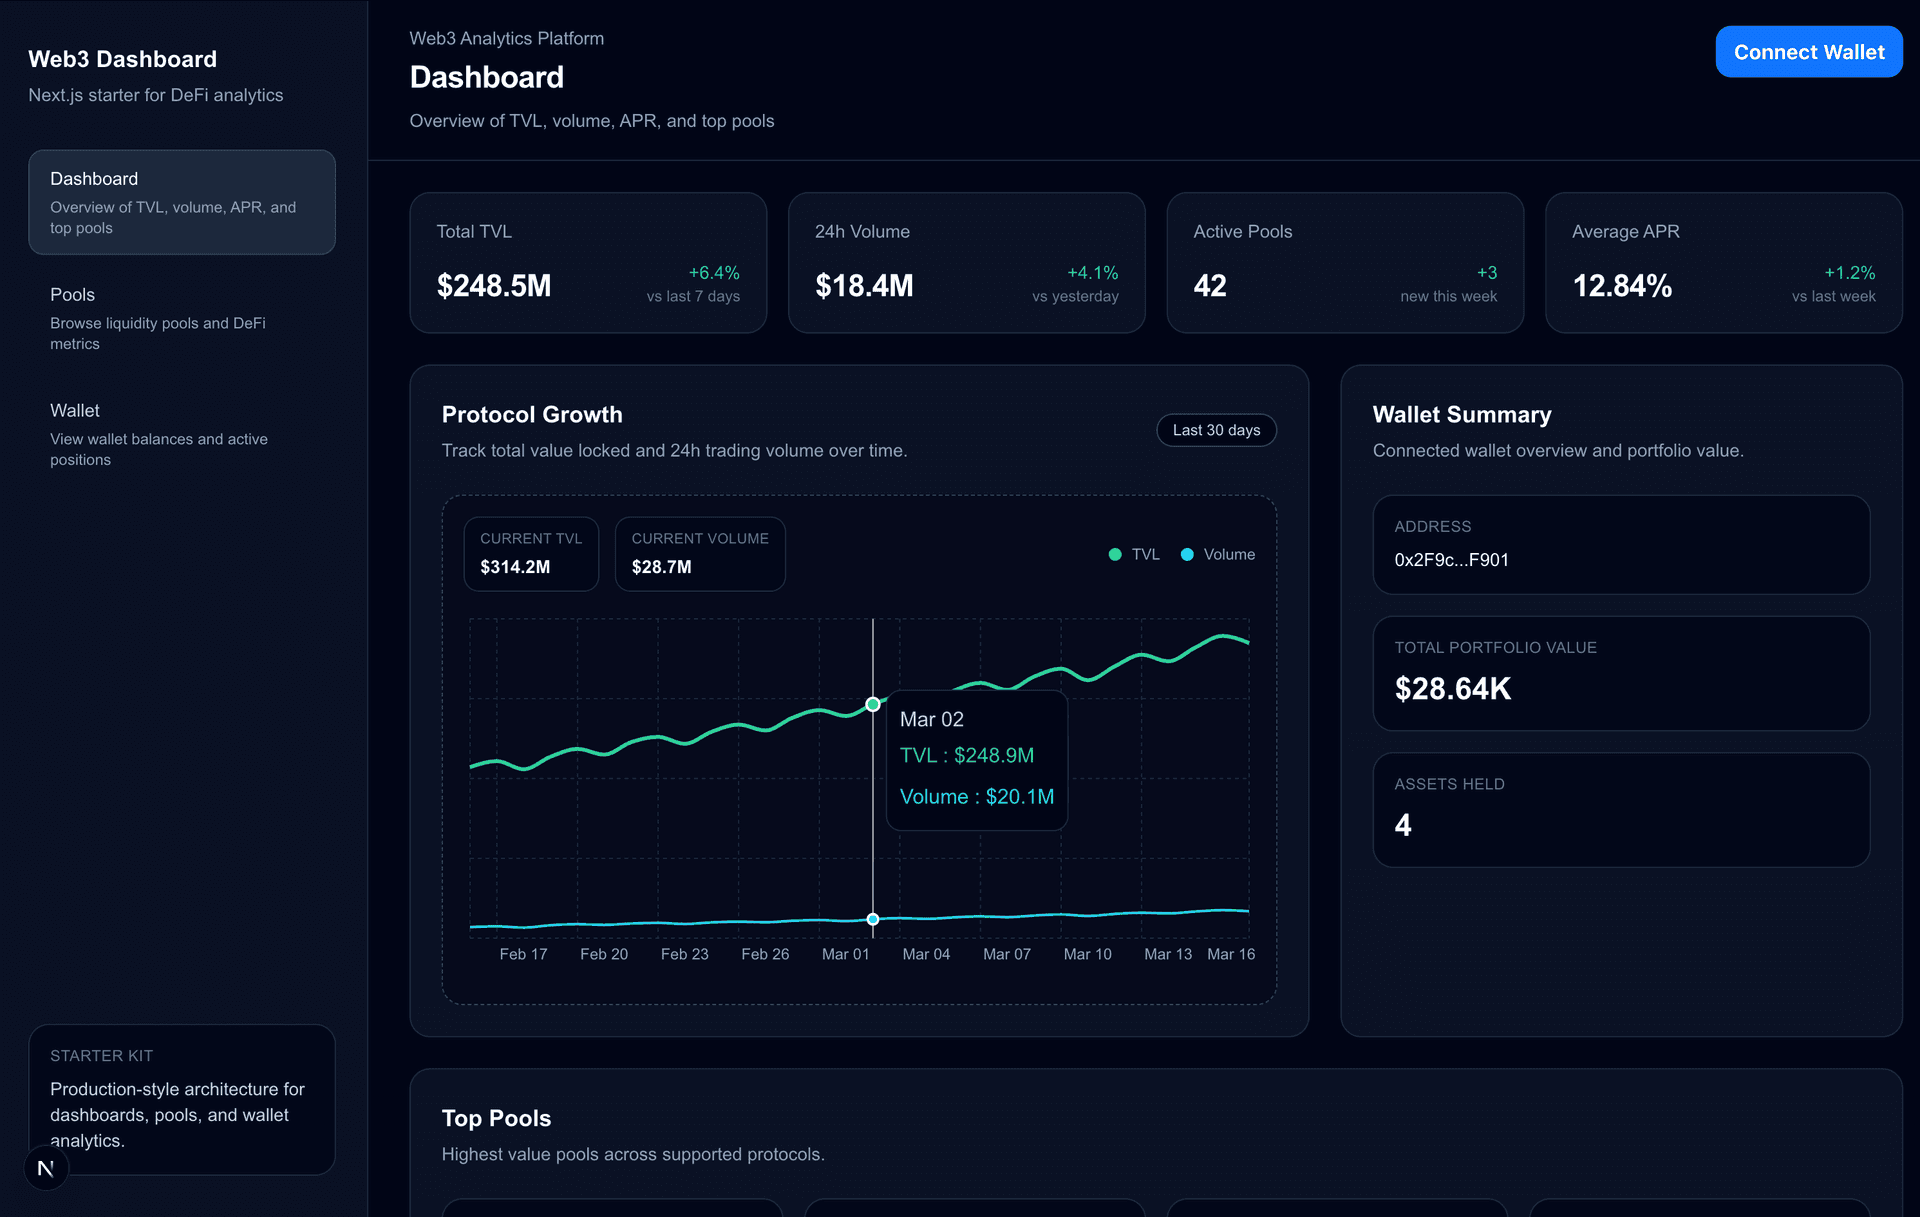
A production-ready Web3 dashboard starter built with Next.js, Wagmi, and RainbowKit — wallet connection, on-chain data fetching, and a clean dashboard UI ready to fork and extend for any DeFi project.
Real-Time Crypto Price Dashboard
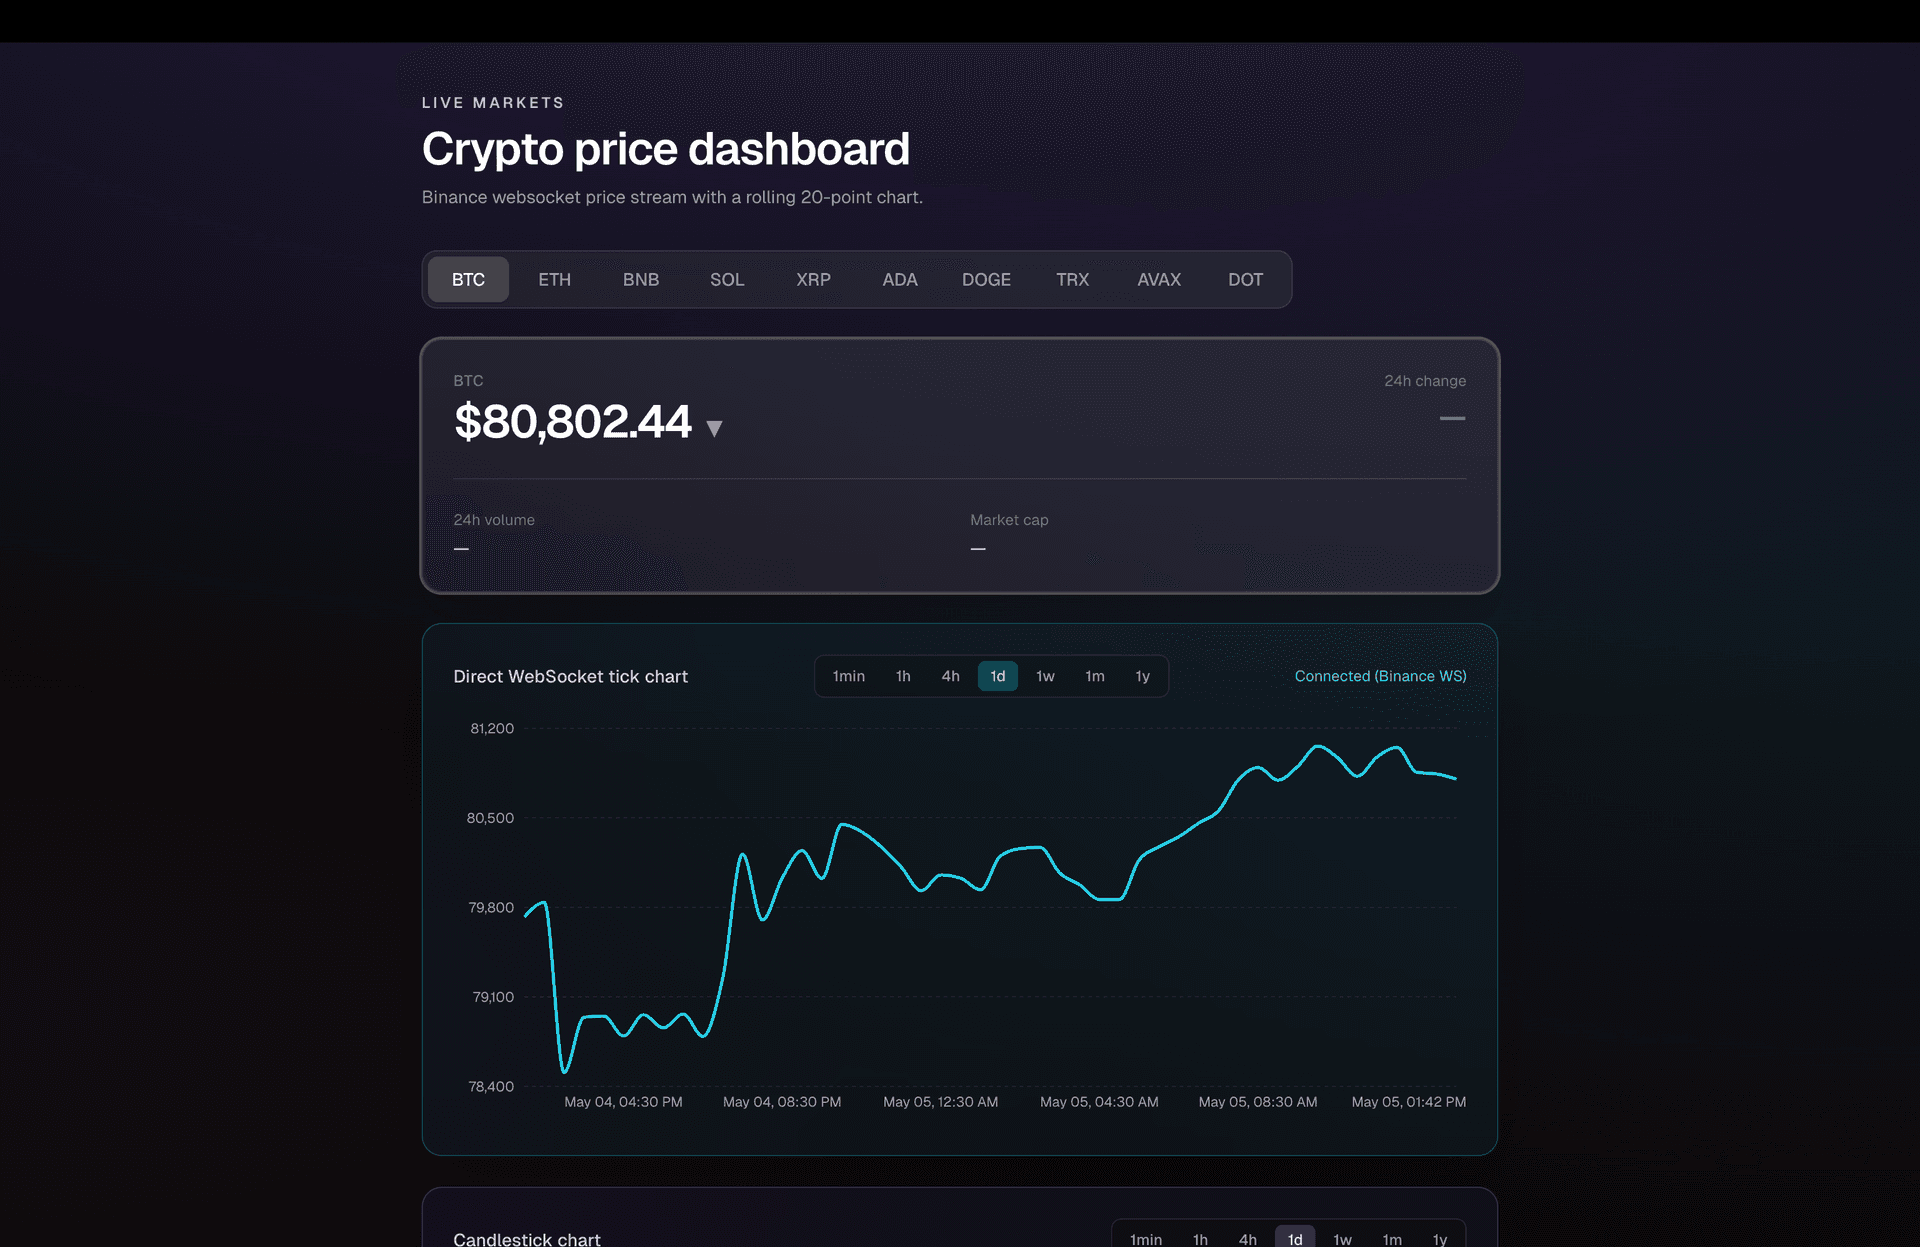
A production-ready crypto analytics dashboard with live price updates, smooth chart rendering, and a premium UI. Built for speed — no layout jank, no loading delays, real data from CoinGecko API.
Web3 Whale Tracker Dashboard
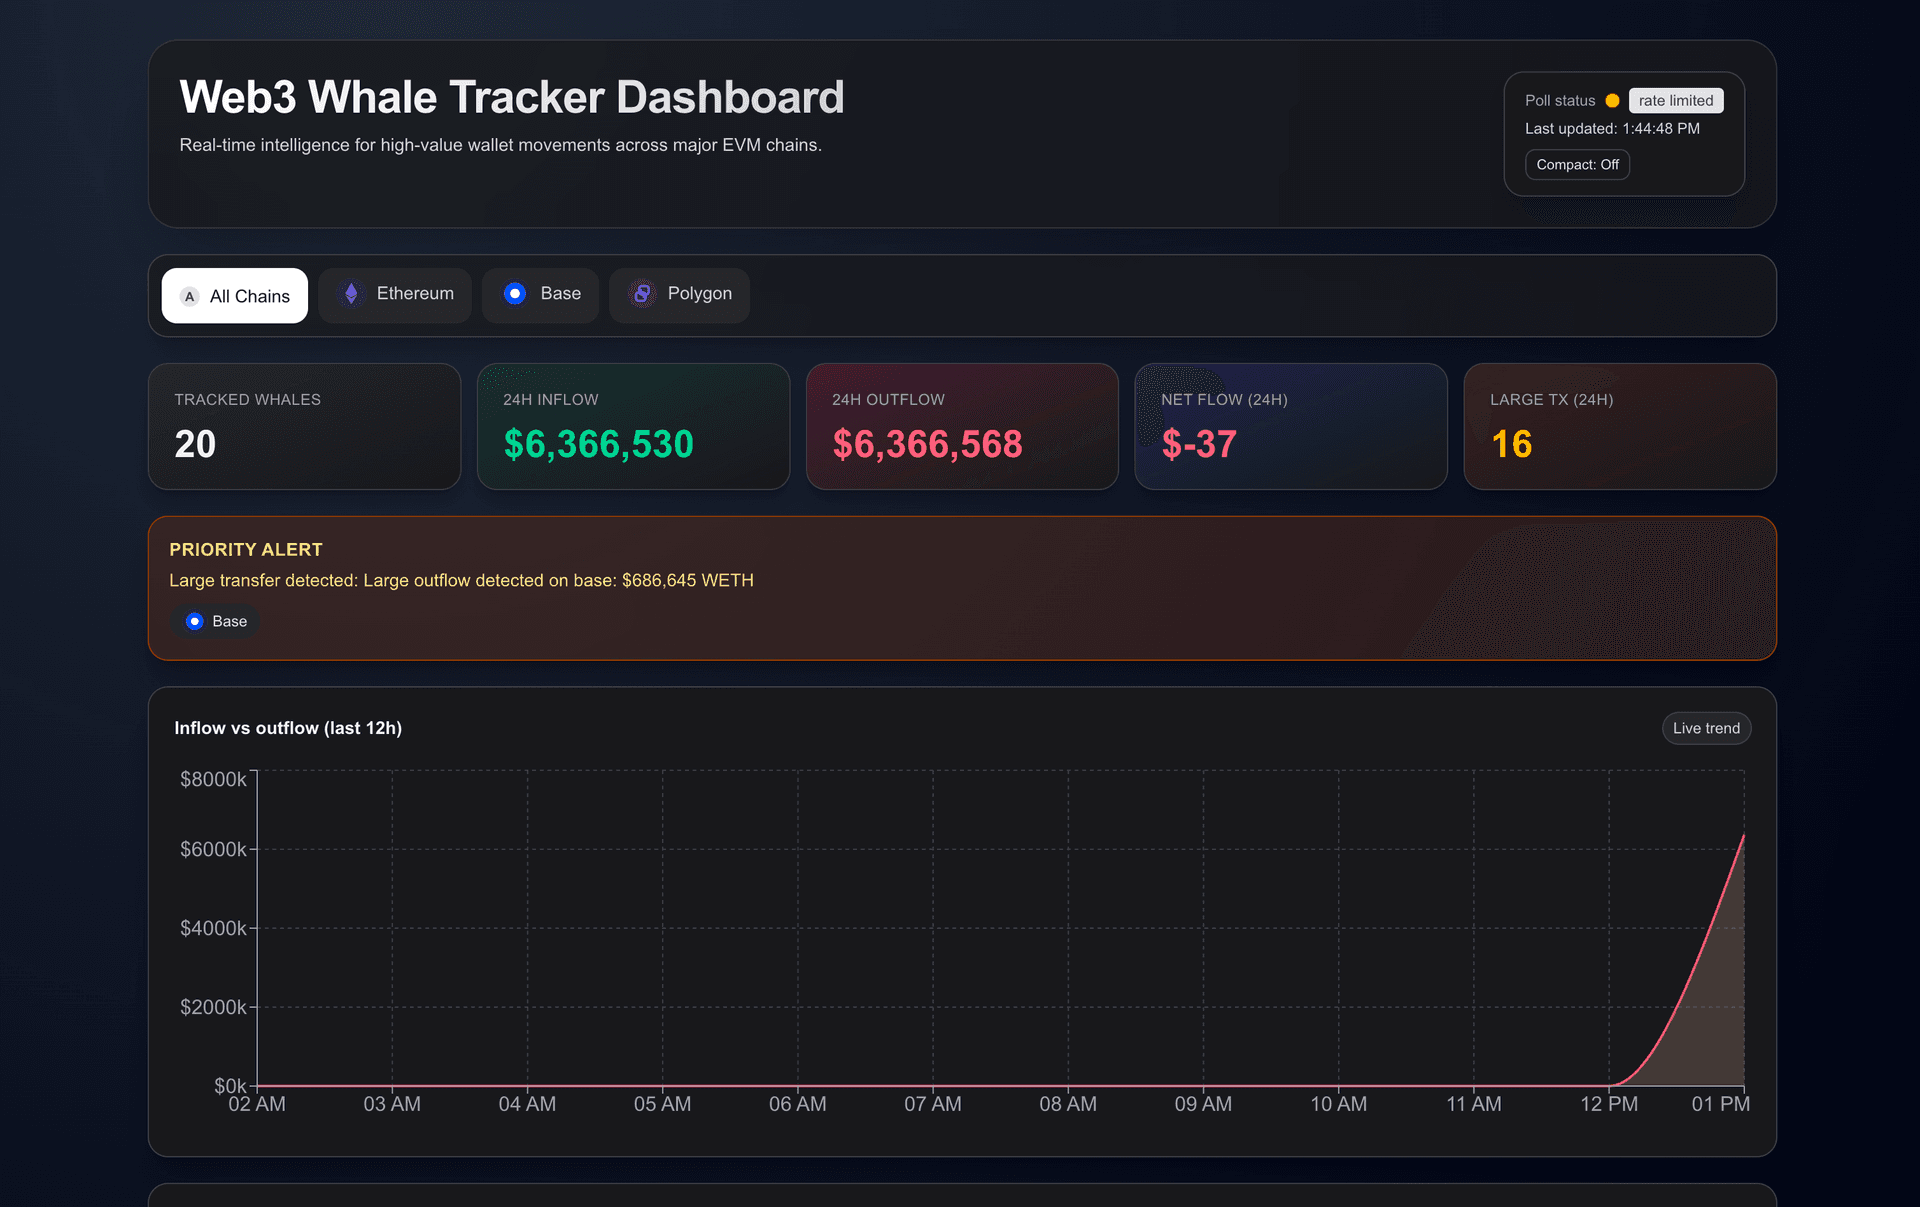
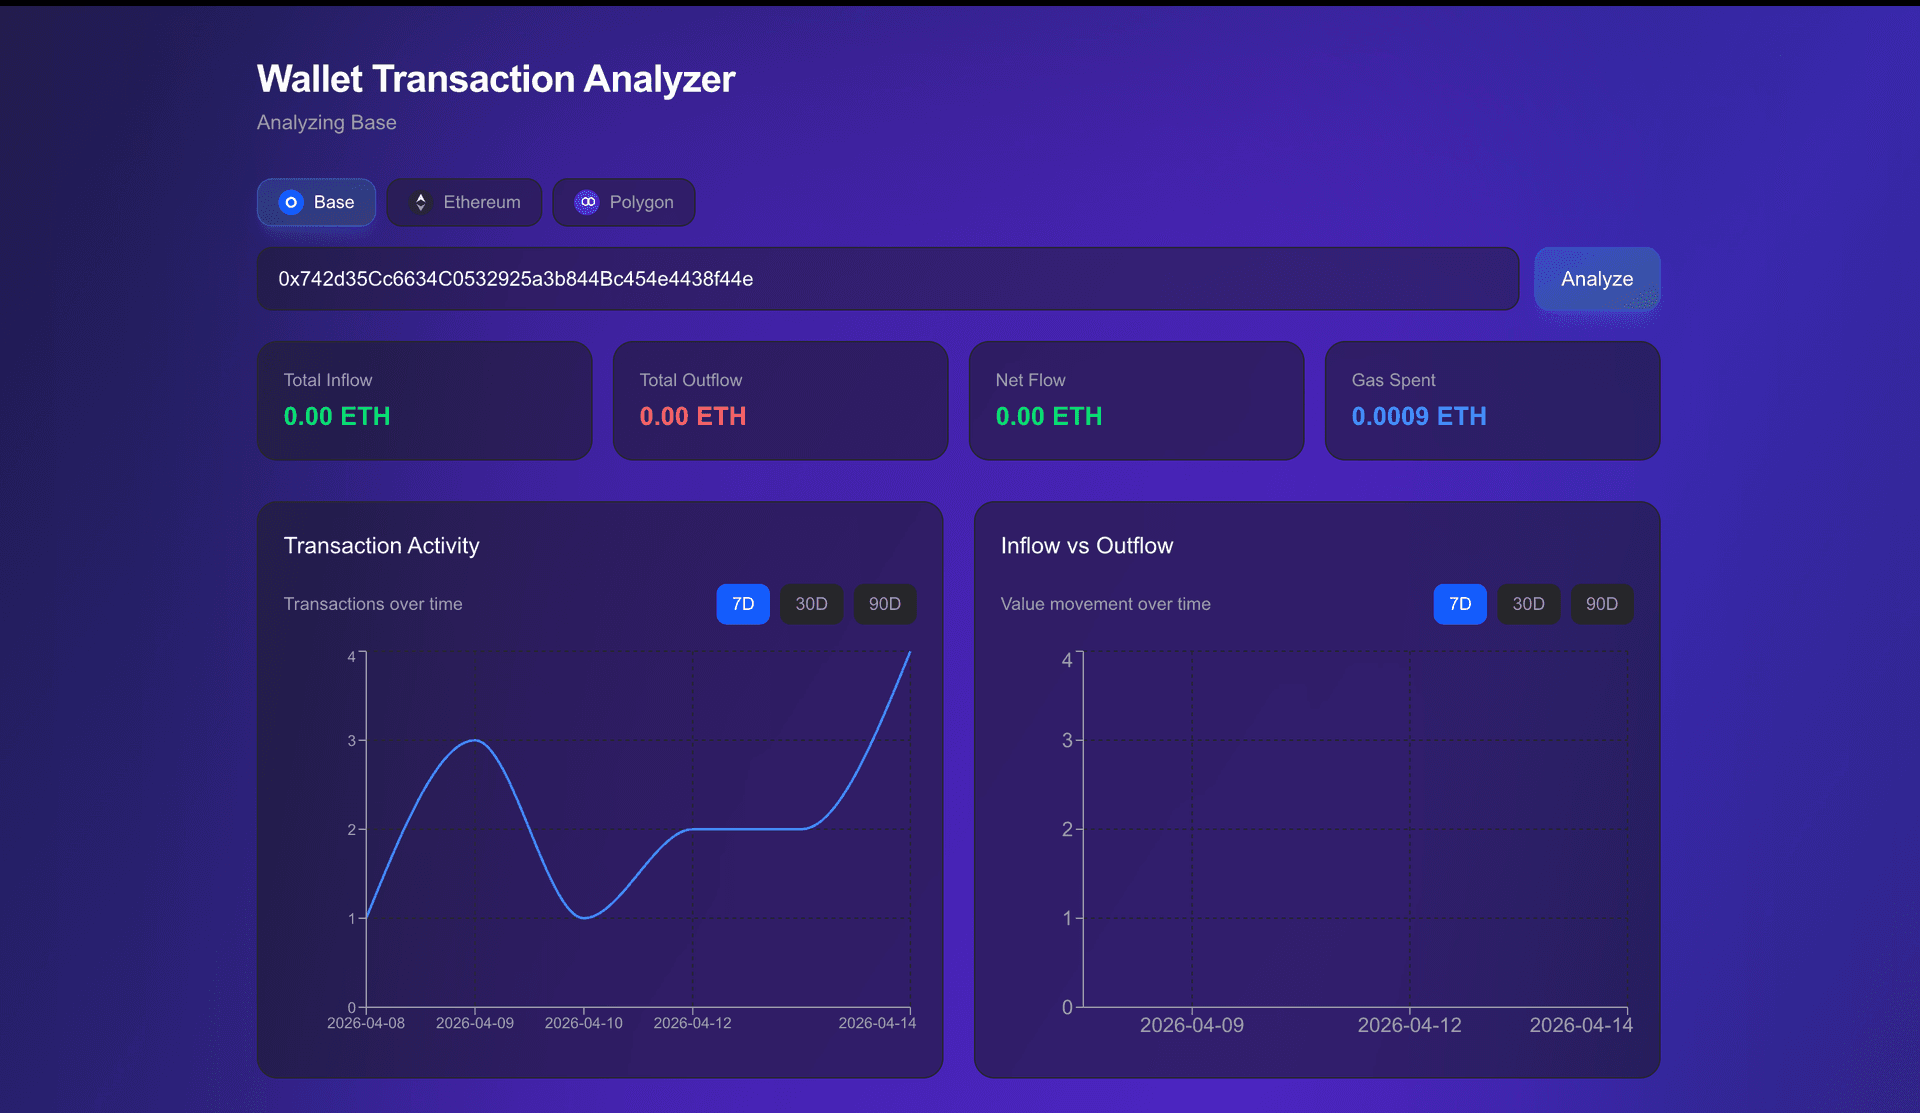
A multi-chain whale tracker that monitors large wallet activity and surfaces major inflows/outflows in near real-time. Built with Moralis for on-chain data and Recharts for clean, filterable data visualization.
Related articles
How to Design Clean and User-Friendly DeFi Dashboard Interfaces
Design principles for DeFi dashboards: data hierarchy, chart design, empty states, mobile responsiveness, and trust signals. Practical UI patterns with React and Tailwind CSS examples.
DeFiUXDesignHow to Build a Token Analytics Dashboard for Web3 Projects
Build a token analytics dashboard with price charts, holder tables, and transaction feeds. Data sources, Next.js architecture, and performance tips with TypeScript code examples.
Web3AnalyticsNext.jsHow to Manage Frontend State for Wallet and On-Chain Data in Web3 Apps
A practical guide to separating wallet state, app state, and server cache state in Web3 dashboards. Covers wagmi, Zustand, TanStack Query, and architecture patterns that scale.
Web3State ManagementReact Query
Related services
Need a Web3 dashboard or frontend like this?
I build production-ready Web3 dashboards, DeFi interfaces, and analytics frontends with Next.js, TypeScript, and Tailwind CSS.