








Overview
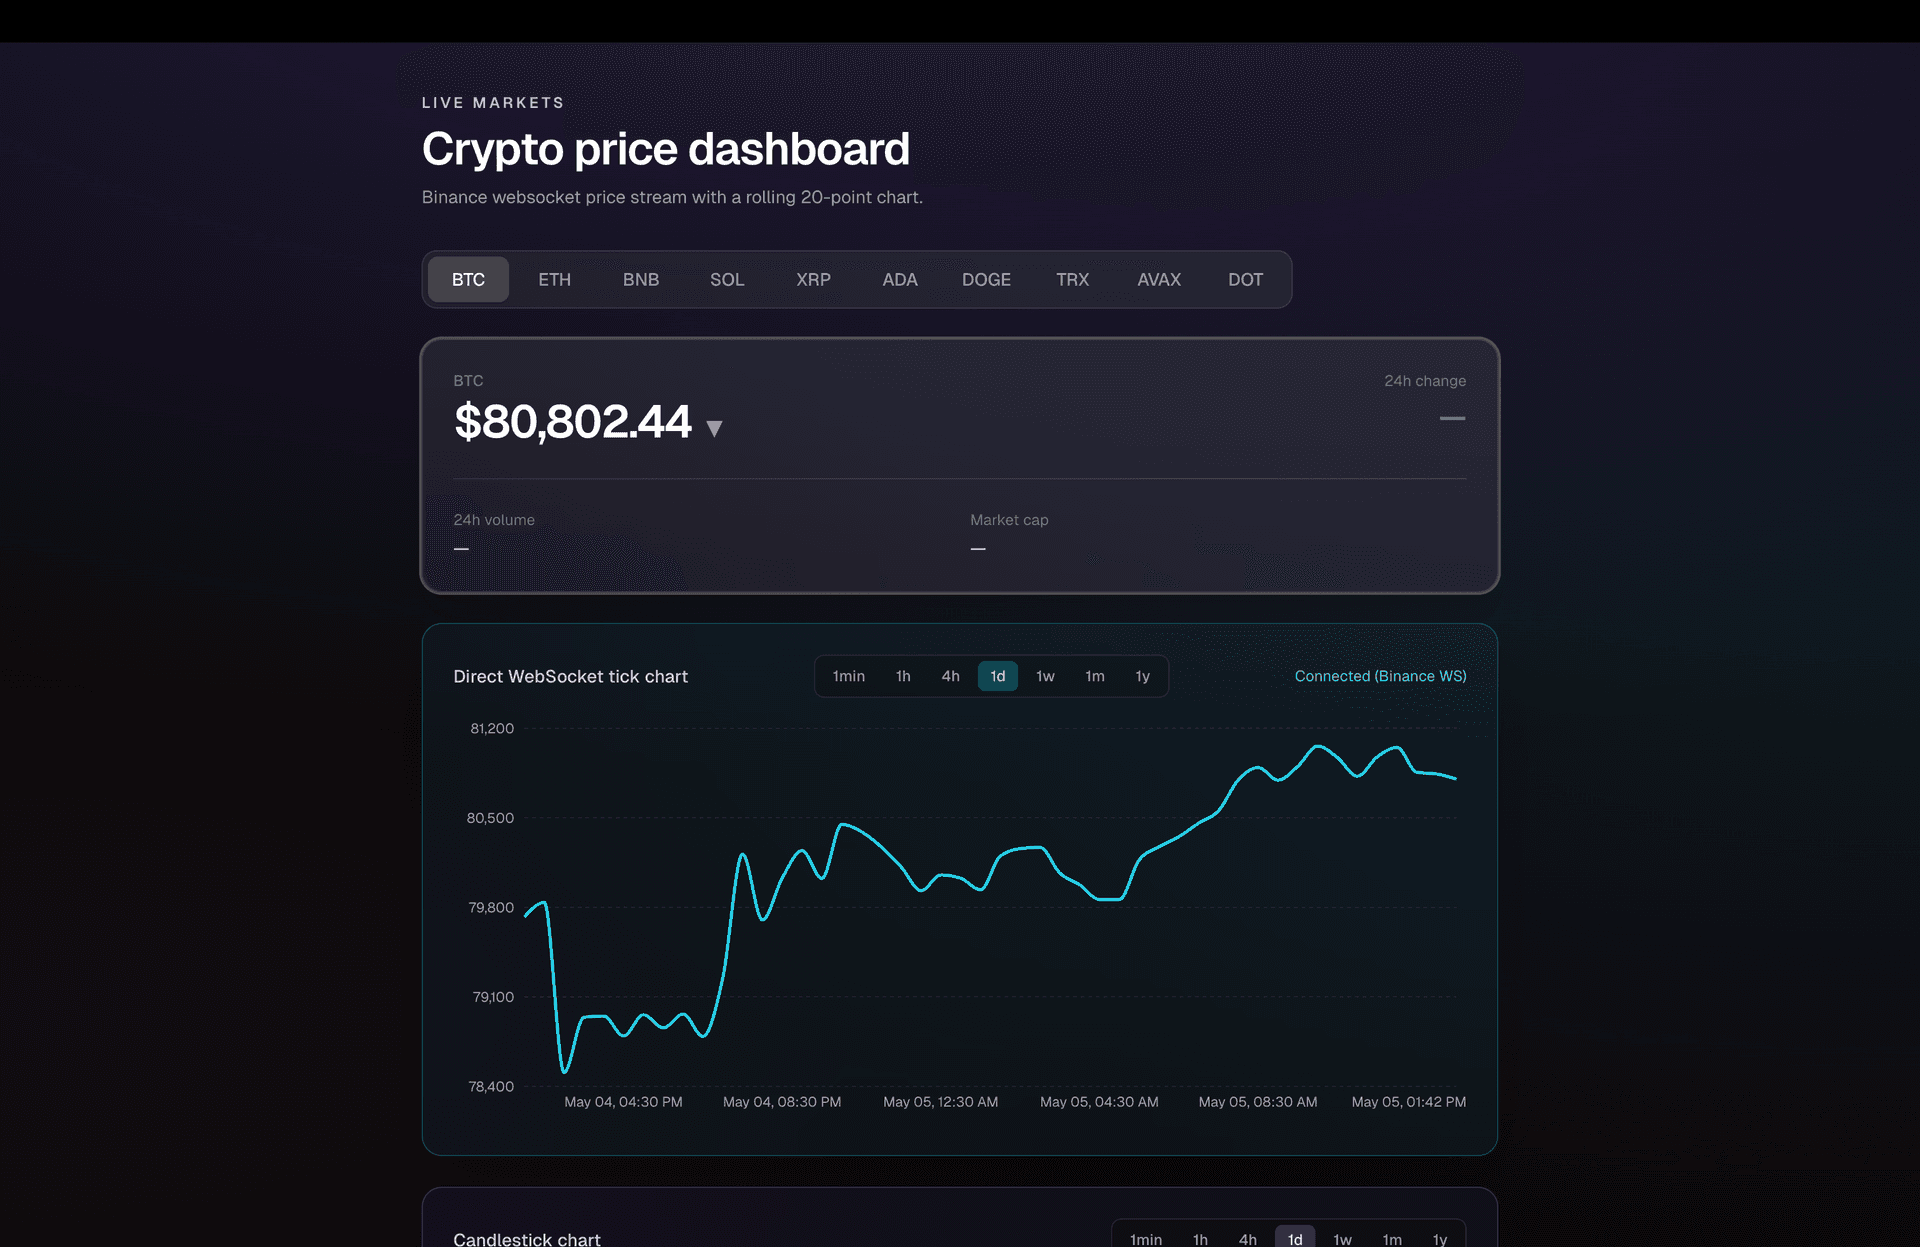
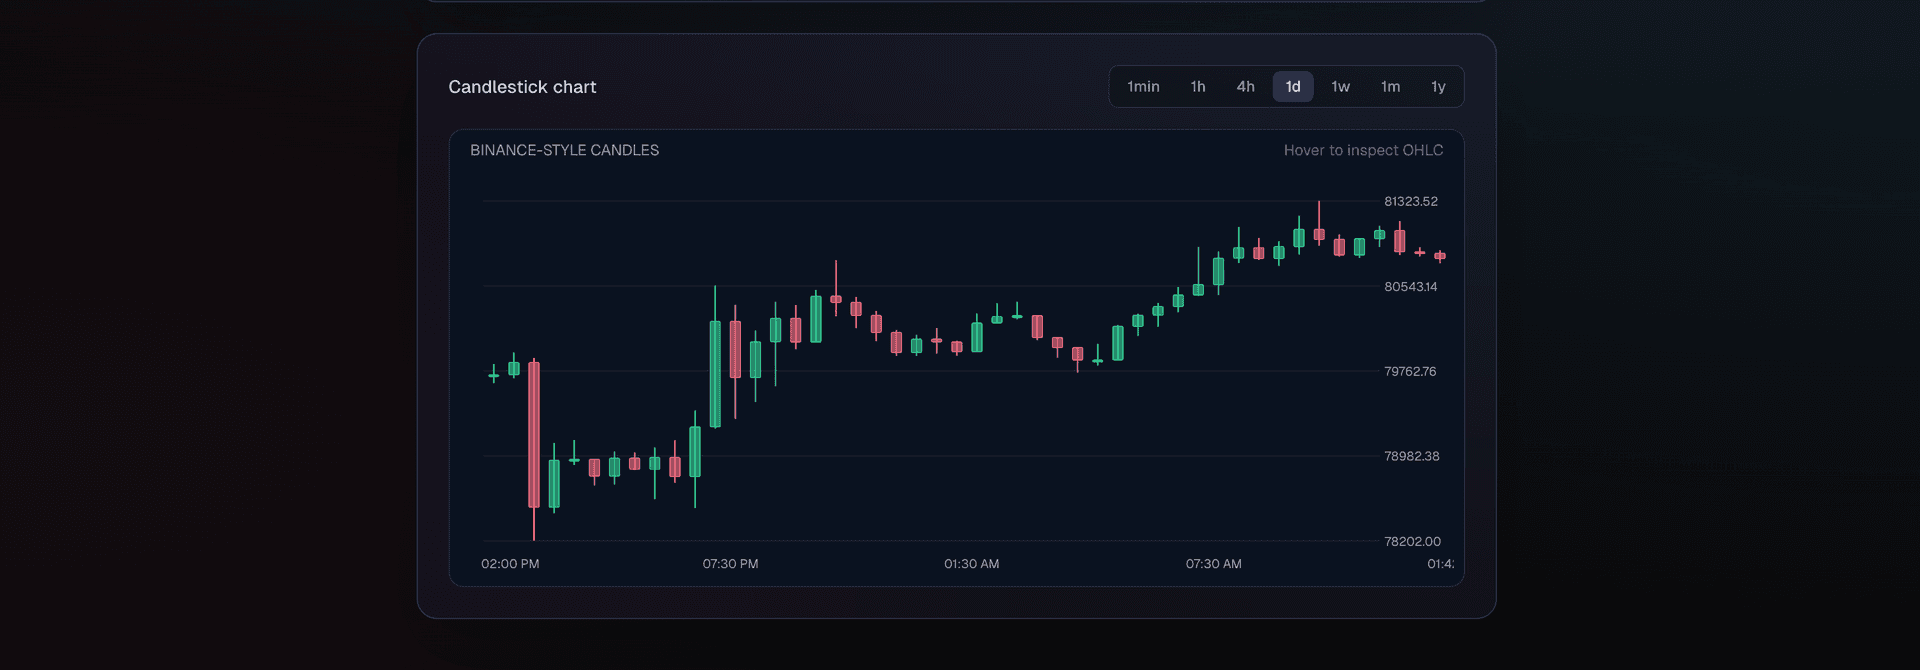
A real-time cryptocurrency price dashboard built with Next.js and TypeScript for tracking live market data across major assets like BTC, ETH, and SOL. Features WebSocket-powered tick charts, candlestick views, and multiple timeframes with 24h change, volume, and market cap at a glance.
Problem
Crypto traders and builders need fast, reliable live price data with smooth chart updates — without layout jank or slow loading on dashboard views.
Solution
Built a real-time crypto price dashboard with WebSocket-powered charts, multiple timeframes, and live market metrics for major assets like BTC, ETH, and SOL.
My role
Sole frontend developer — chart implementation, real-time data pipeline, UI, and performance optimization.
Key features
- Live price updates via Binance WebSocket API
- Tick and candlestick chart views
- Multiple timeframes from 1m to 1y
- 24h change, volume, and market cap metrics
- Smooth chart rendering with Recharts
Results & impact
Delivers a responsive charting experience with live updates and multiple timeframes, suitable as a foundation for crypto analytics or trading dashboards.
Technology stack
- Binance WebSocket API
- Recharts
- Next.js
- TypeScript
Screenshots
Related projects
Web3 Whale Tracker Dashboard
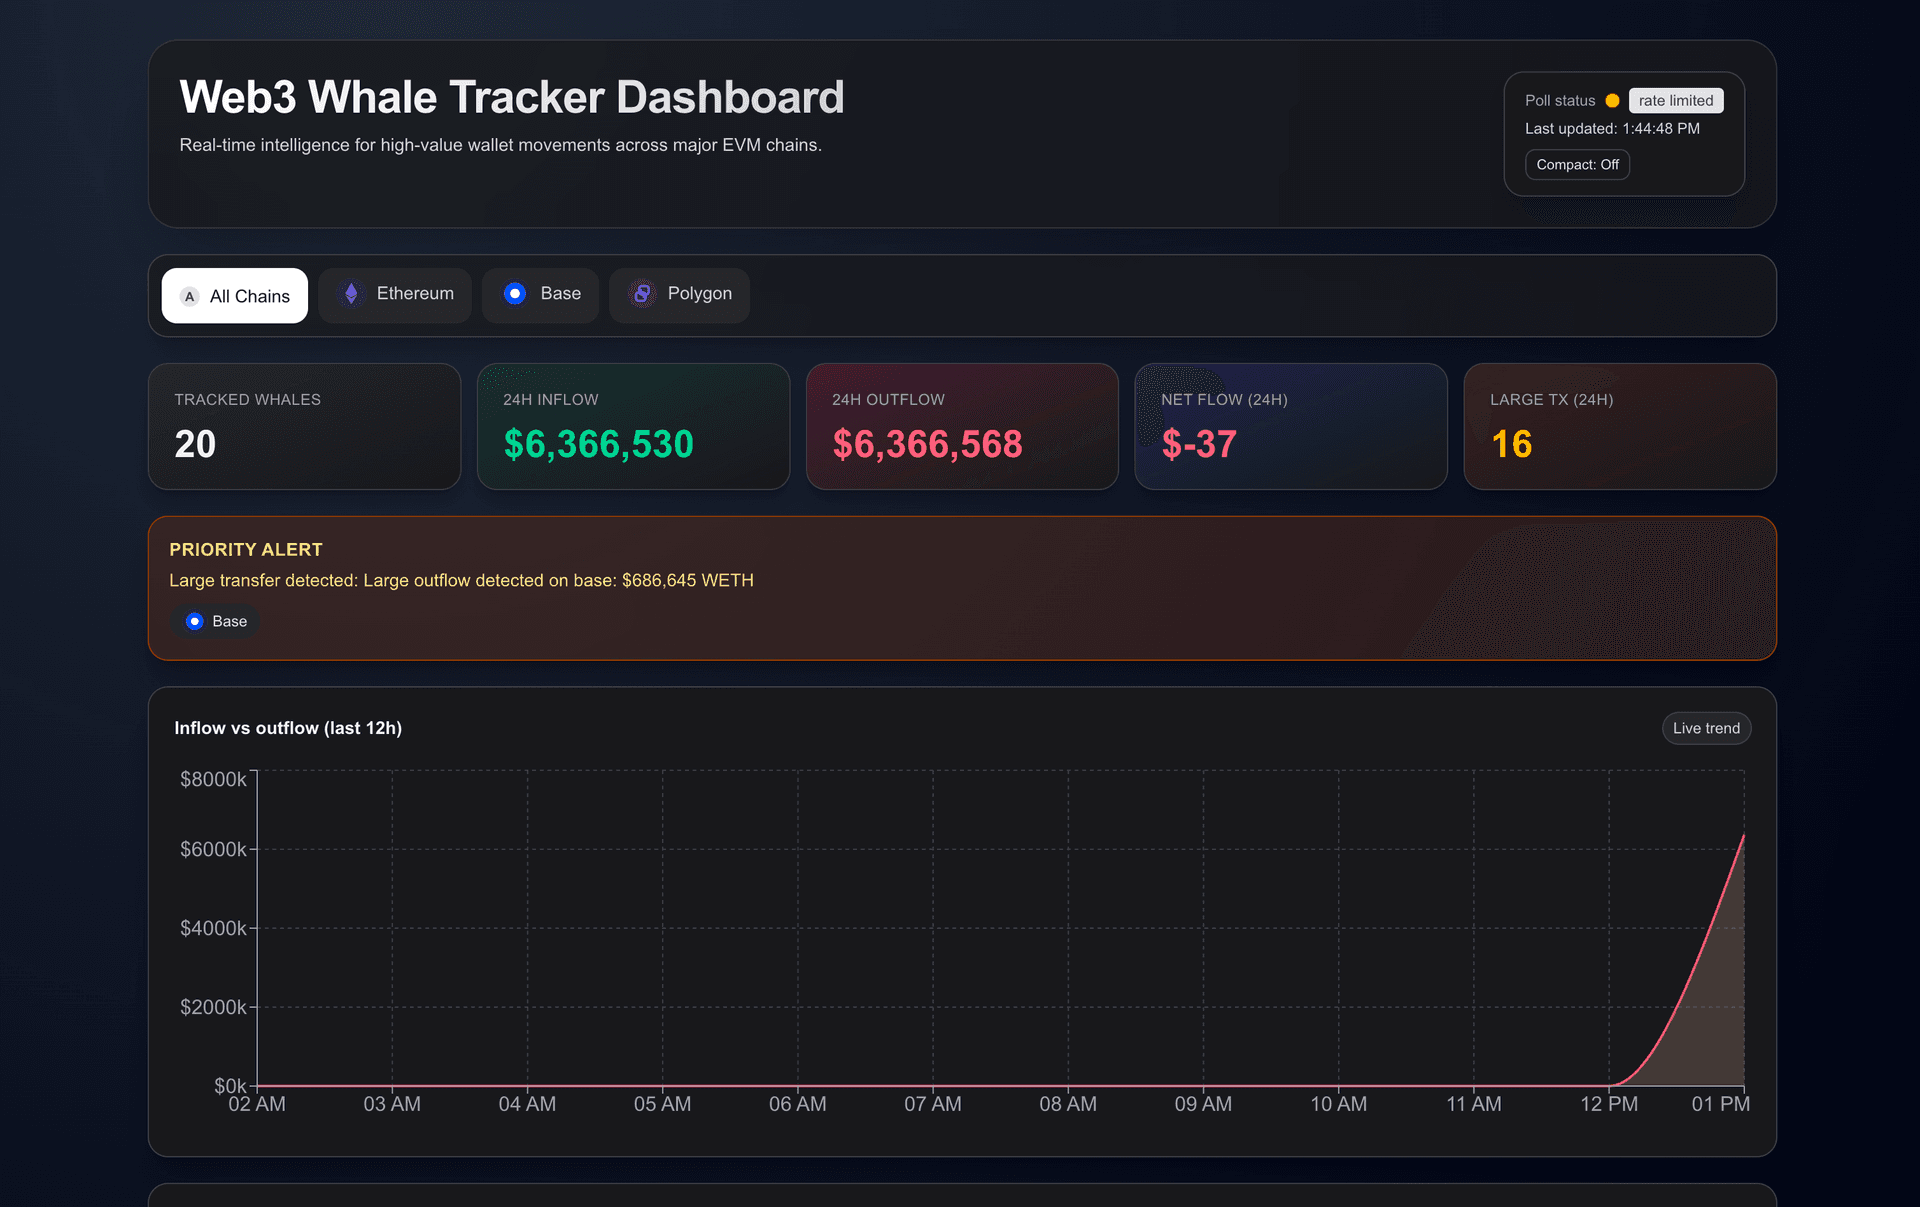
A multi-chain whale tracker that monitors large wallet activity and surfaces major inflows/outflows in near real-time. Built with Moralis for on-chain data and Recharts for clean, filterable data visualization.
DeFi Yield Aggregator Dashboard
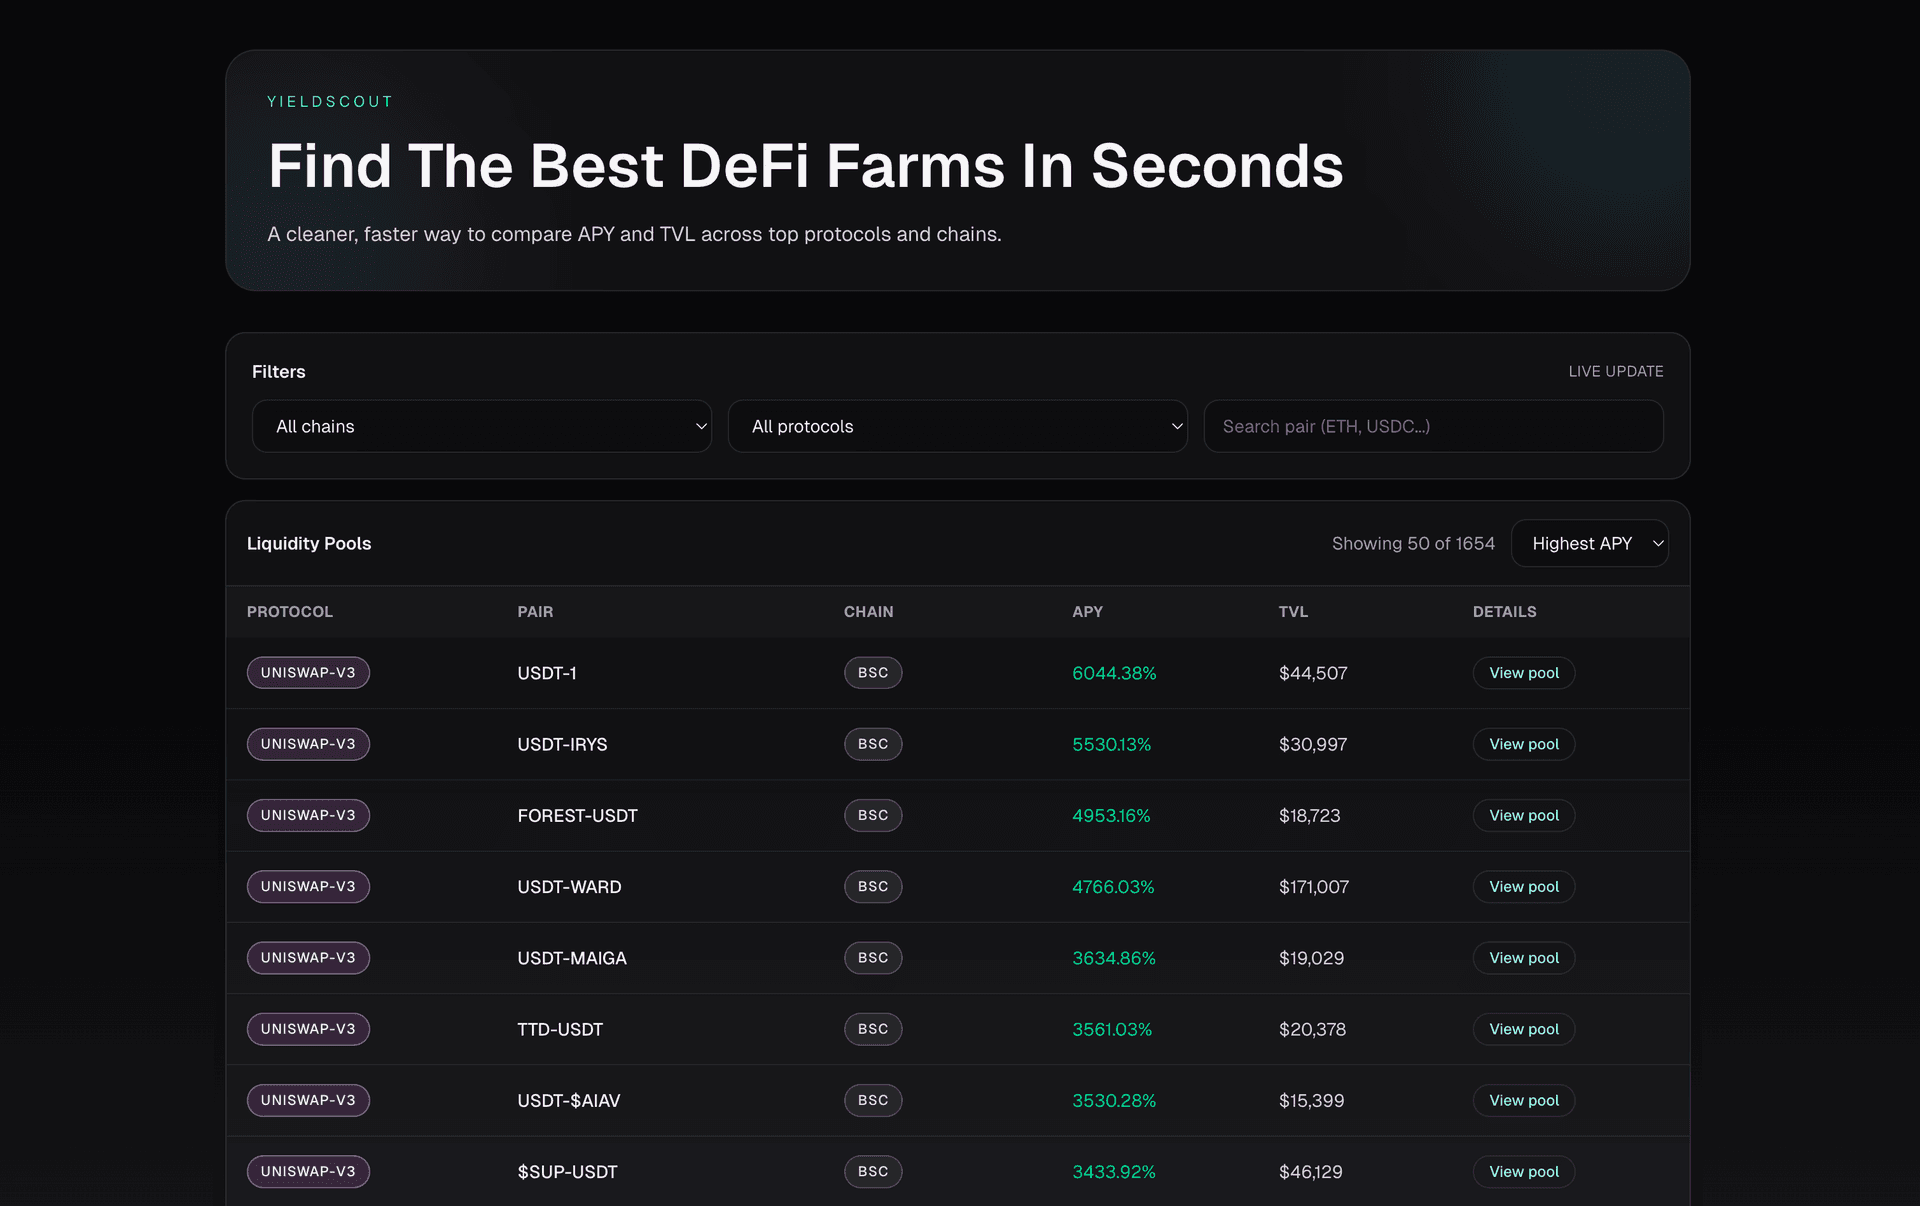
A modern DeFi analytics dashboard that aggregates yield data across protocols and chains with clear APY comparisons — helping users find the best opportunities without checking 10+ platforms manually.
Production-ready Web3 dashboard
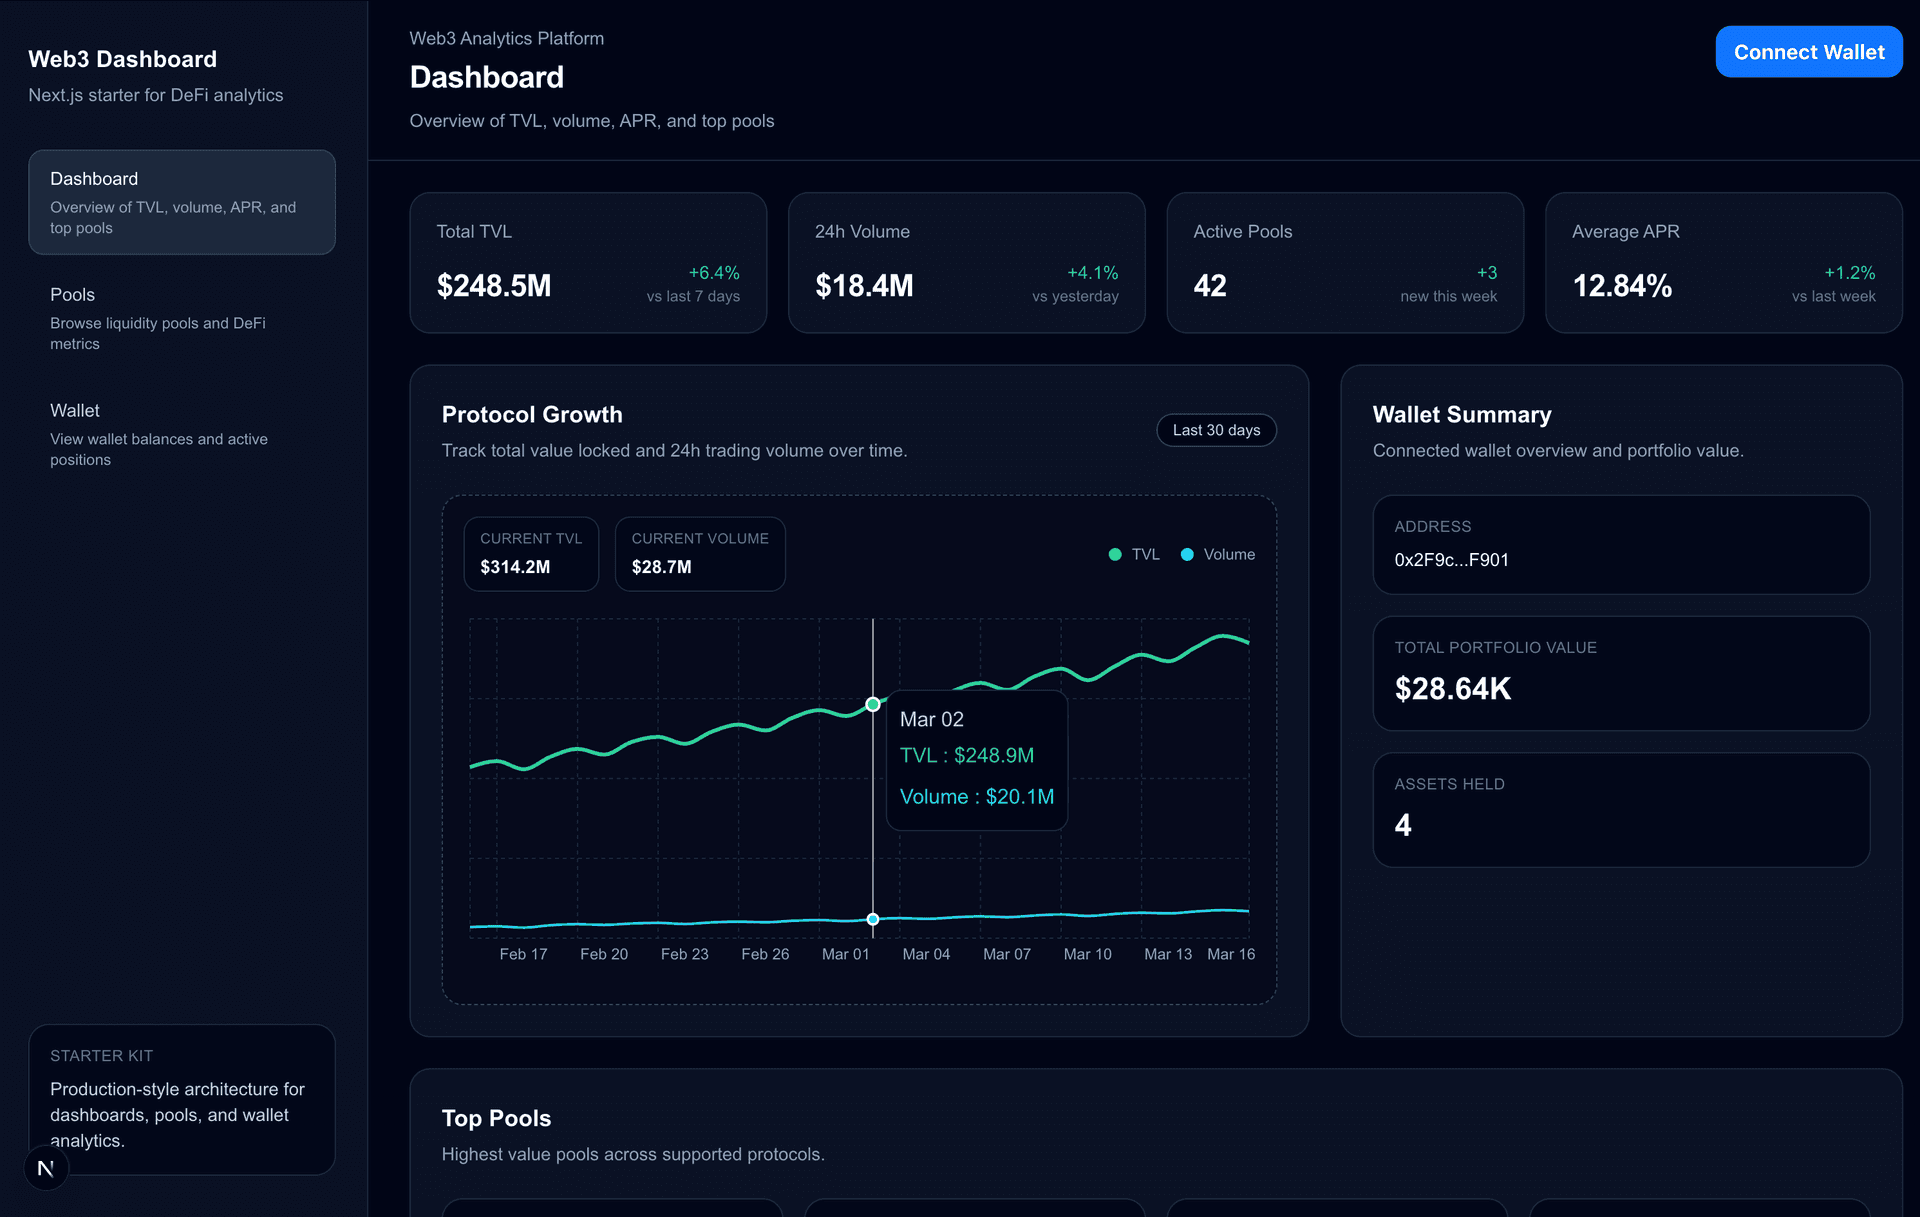
A production-ready Web3 dashboard starter built with Next.js, Wagmi, and RainbowKit — wallet connection, on-chain data fetching, and a clean dashboard UI ready to fork and extend for any DeFi project.
Related articles
How to Improve Performance in React and Next.js Dashboards
Fix slow dashboards with memoization, virtualization, lazy-loaded charts, API caching, and bundle optimization. Practical checklist for React and Next.js performance.
PerformanceReactNext.jsBest Chart UI Practices for Web3 and Finance Dashboards
Choosing chart types, avoiding misleading visuals, tooltips, mobile chart UX, and performance tips. Recharts and TradingView Lightweight Charts examples for DeFi dashboards.
ChartsRechartsDeFiPolling vs Caching vs Real-Time Updates in Web3 Dashboards
When to poll, when to cache, and when to use WebSockets for on-chain data. Trade-offs between speed, cost, and accuracy with practical examples using RPCs, The Graph, and TanStack Query.
Web3PerformanceReact Query
Related services
Need a Web3 dashboard or frontend like this?
I build production-ready Web3 dashboards, DeFi interfaces, and analytics frontends with Next.js, TypeScript, and Tailwind CSS.