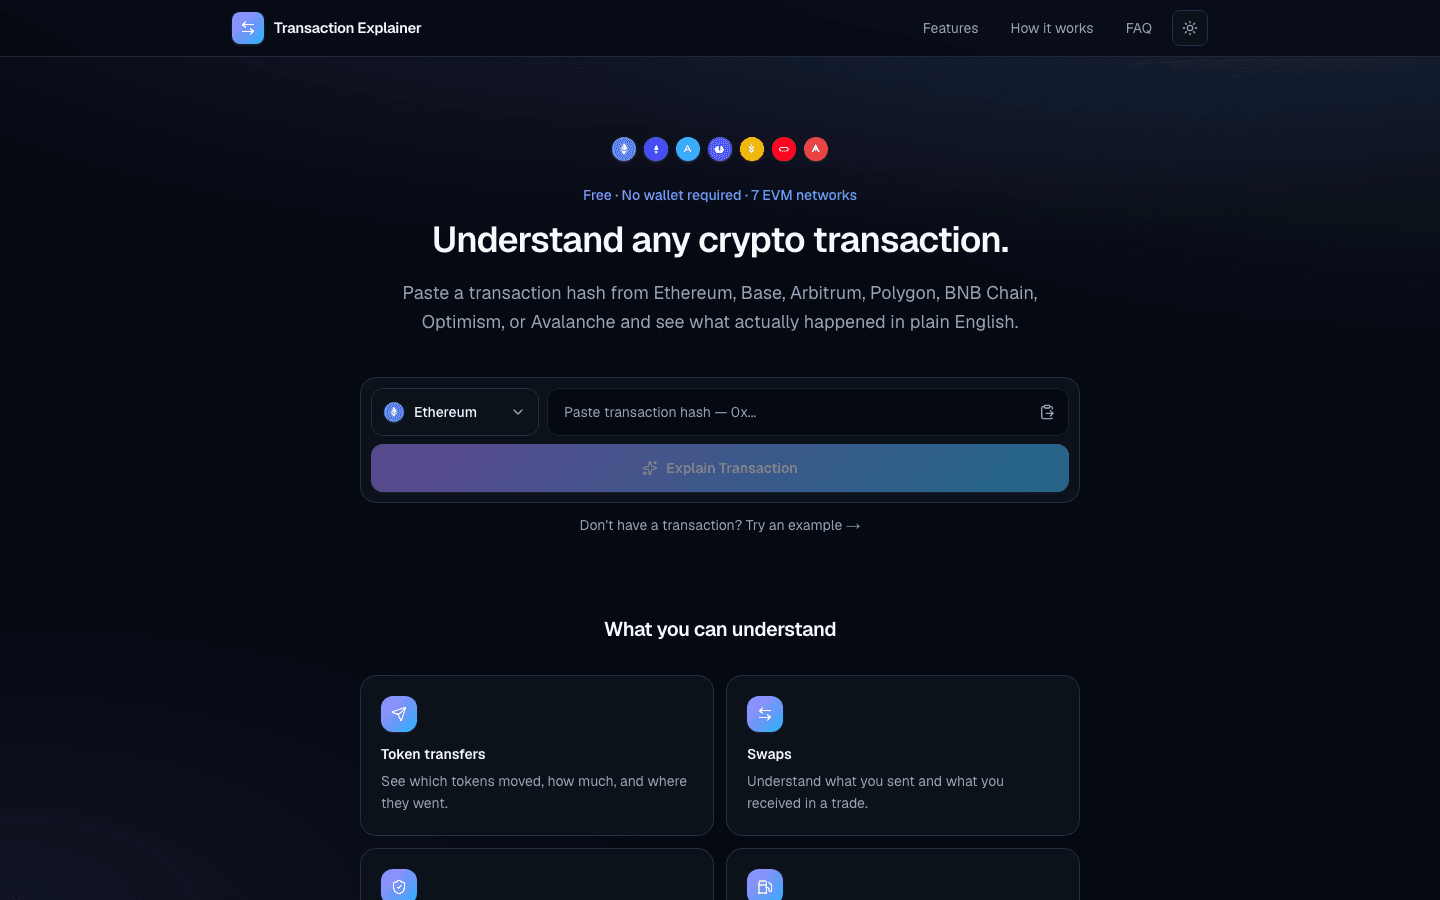
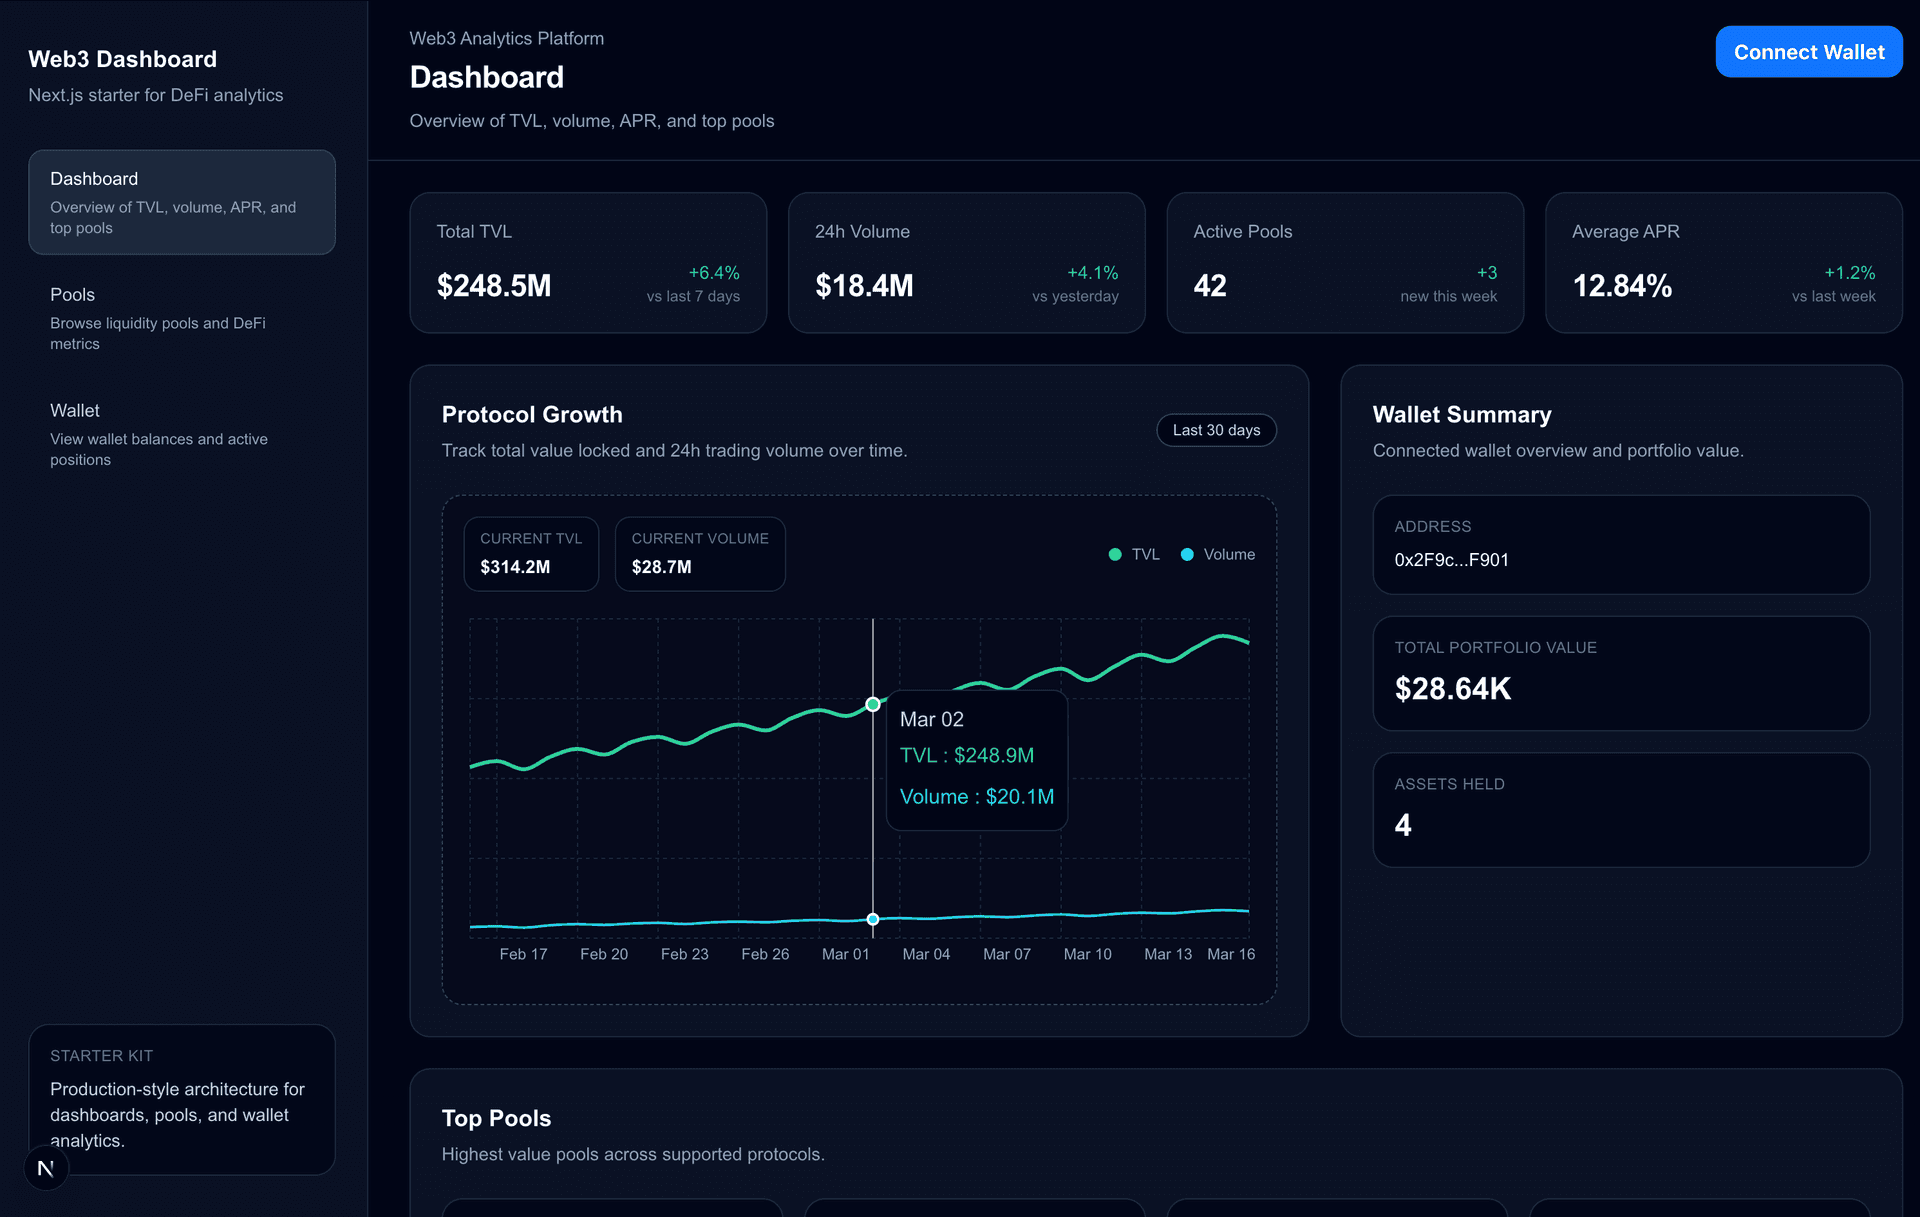
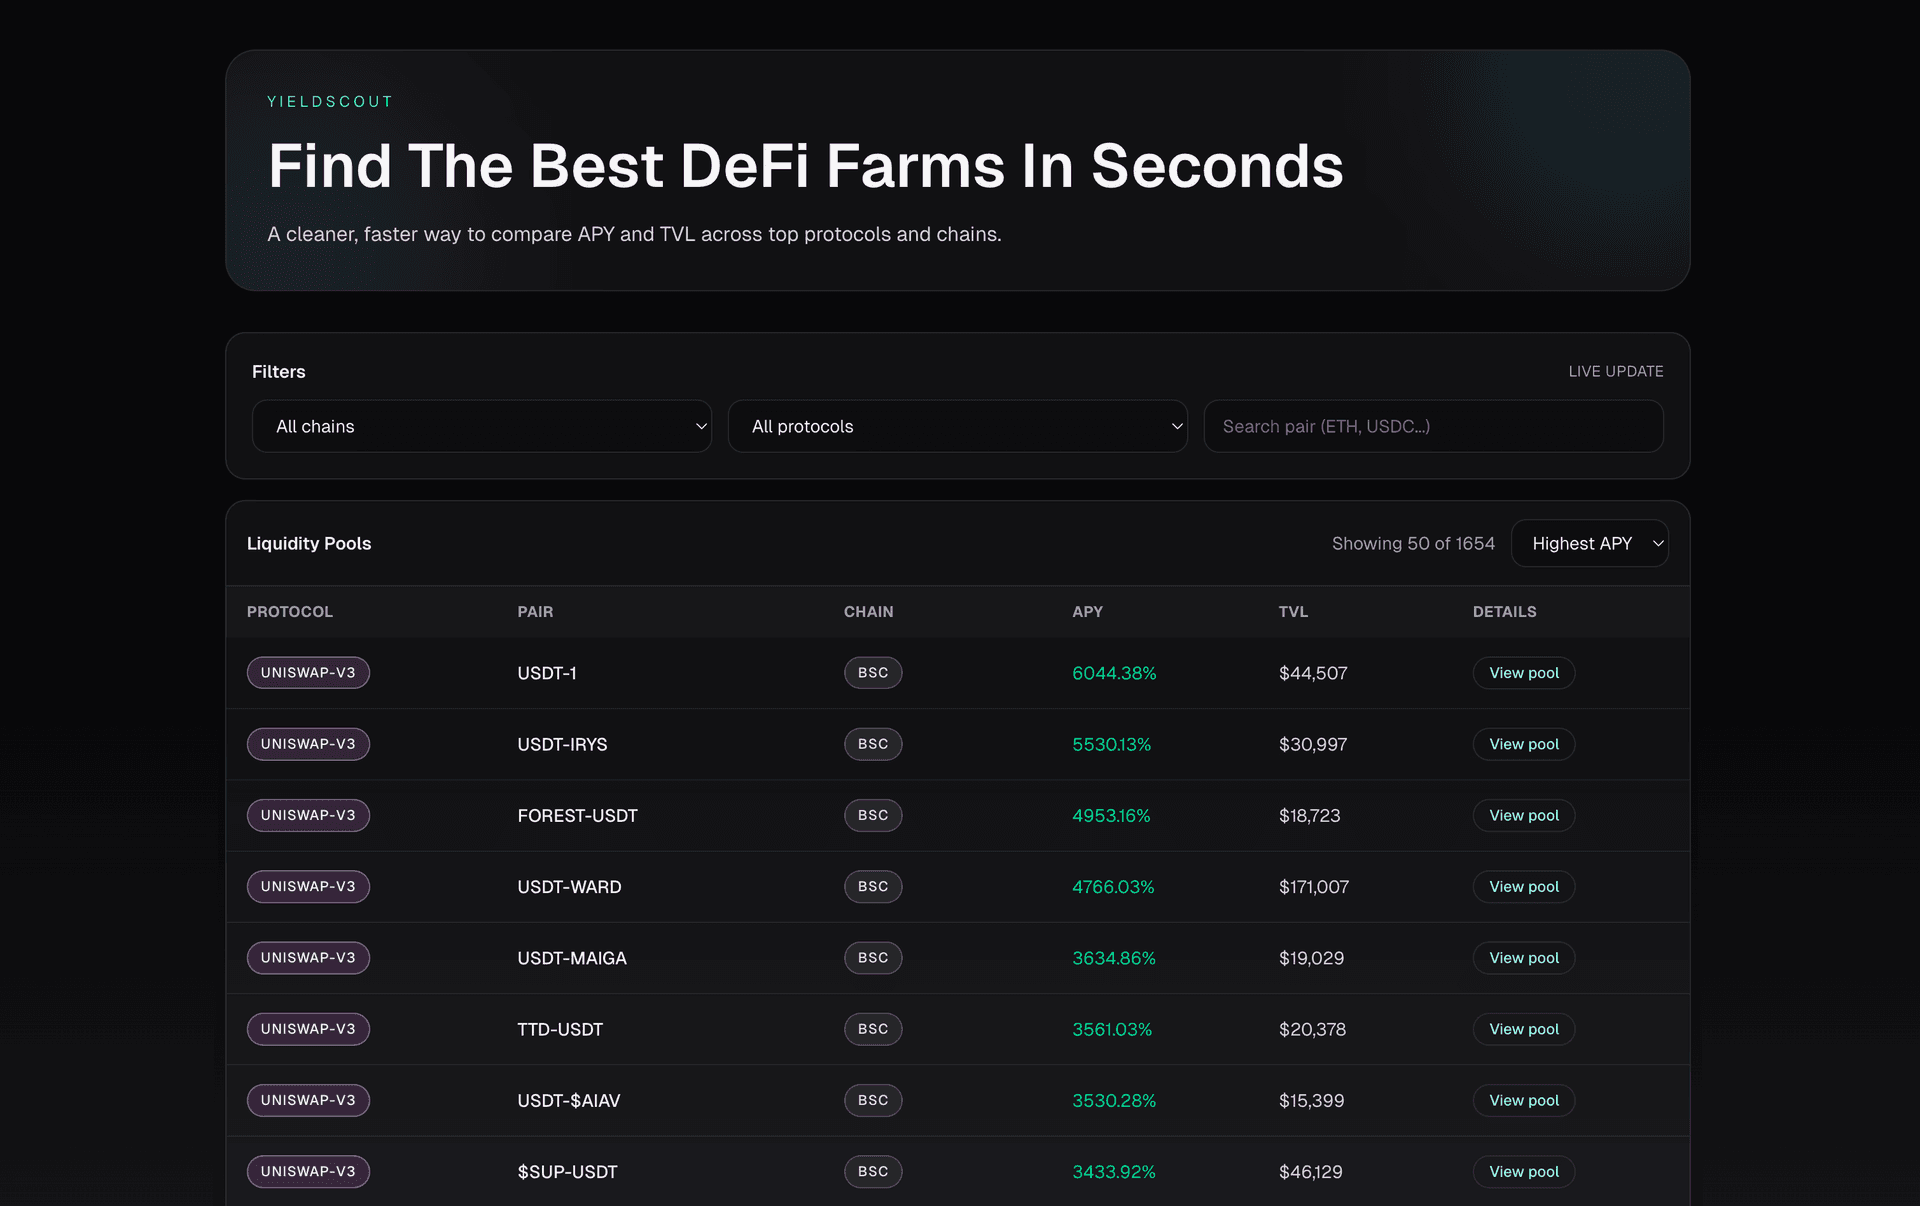
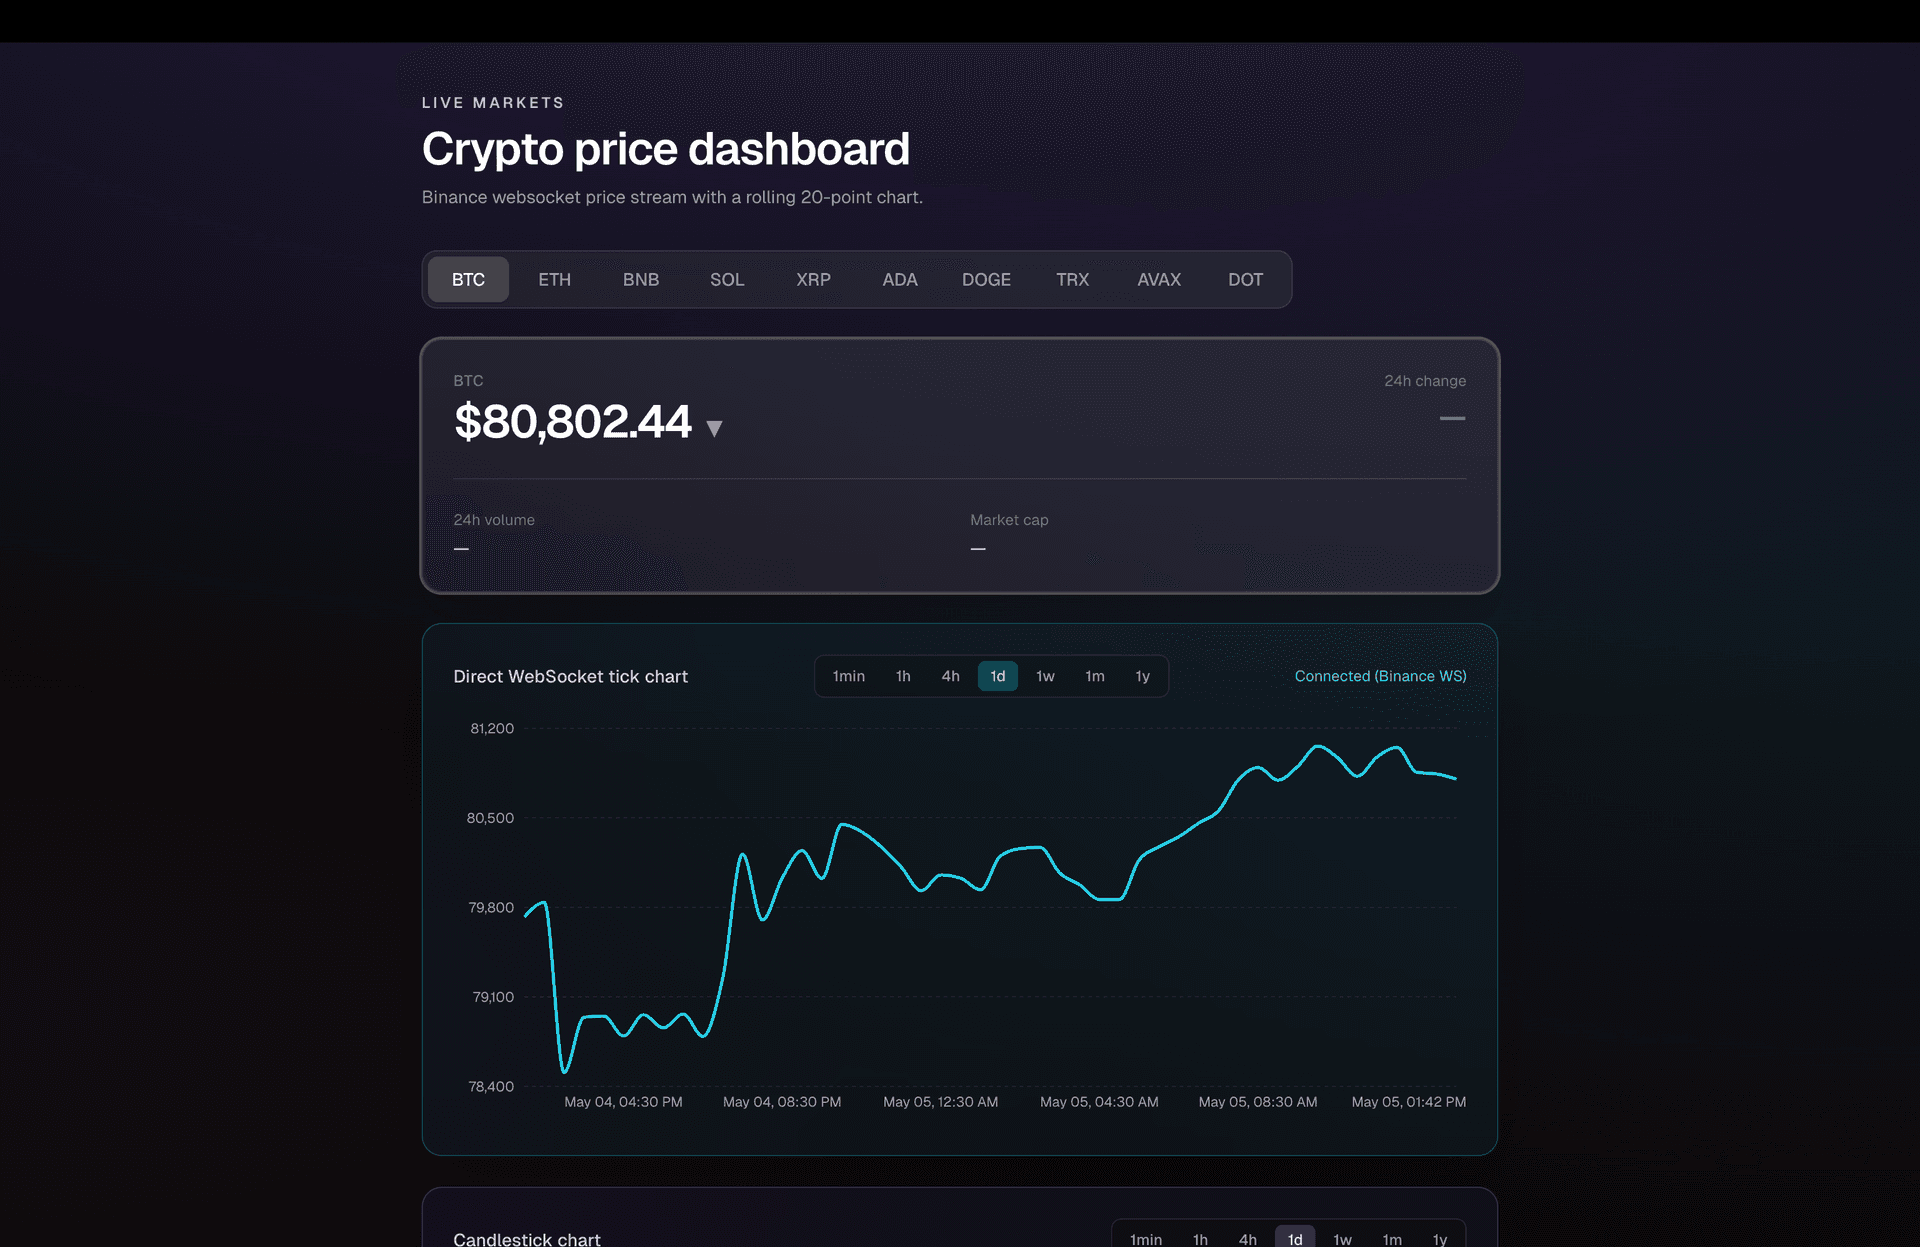







Overview
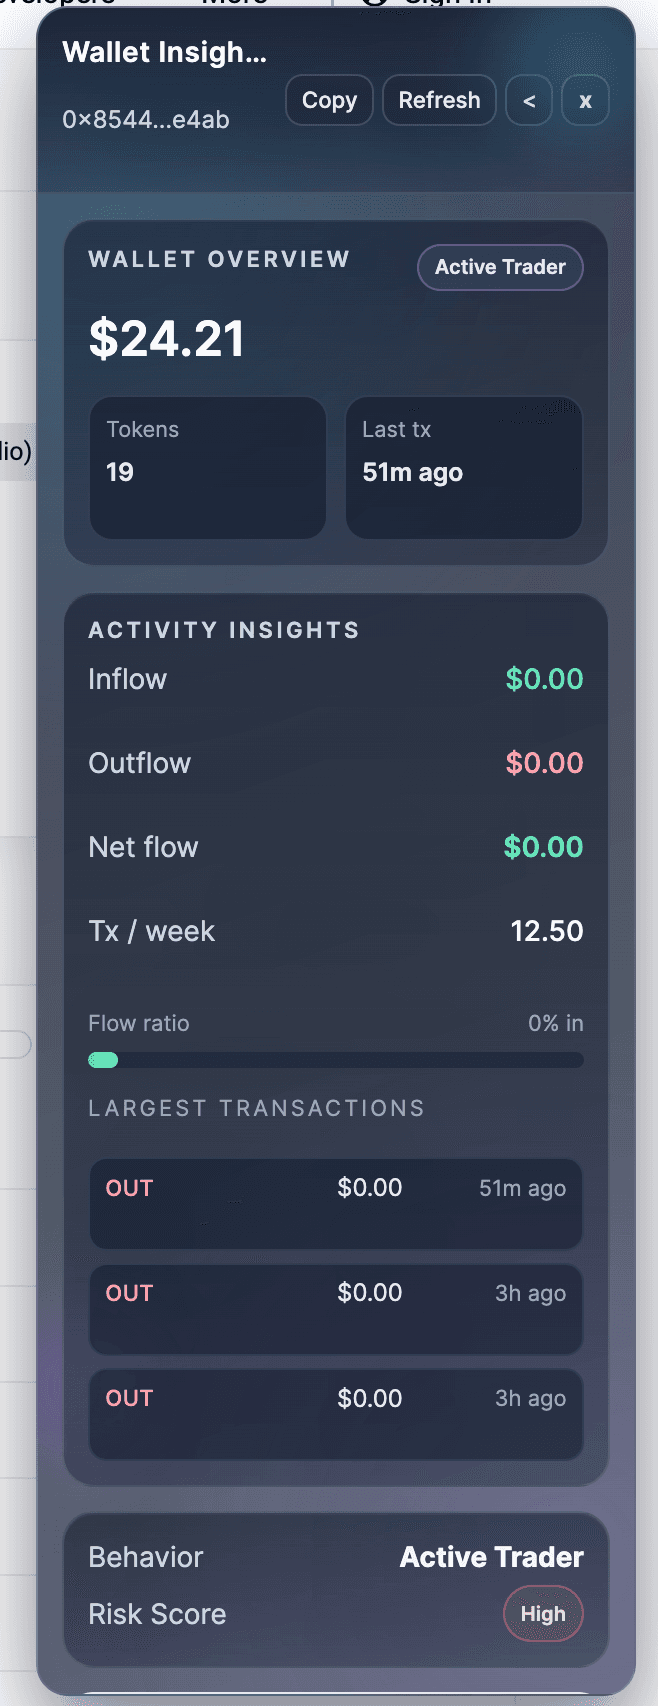
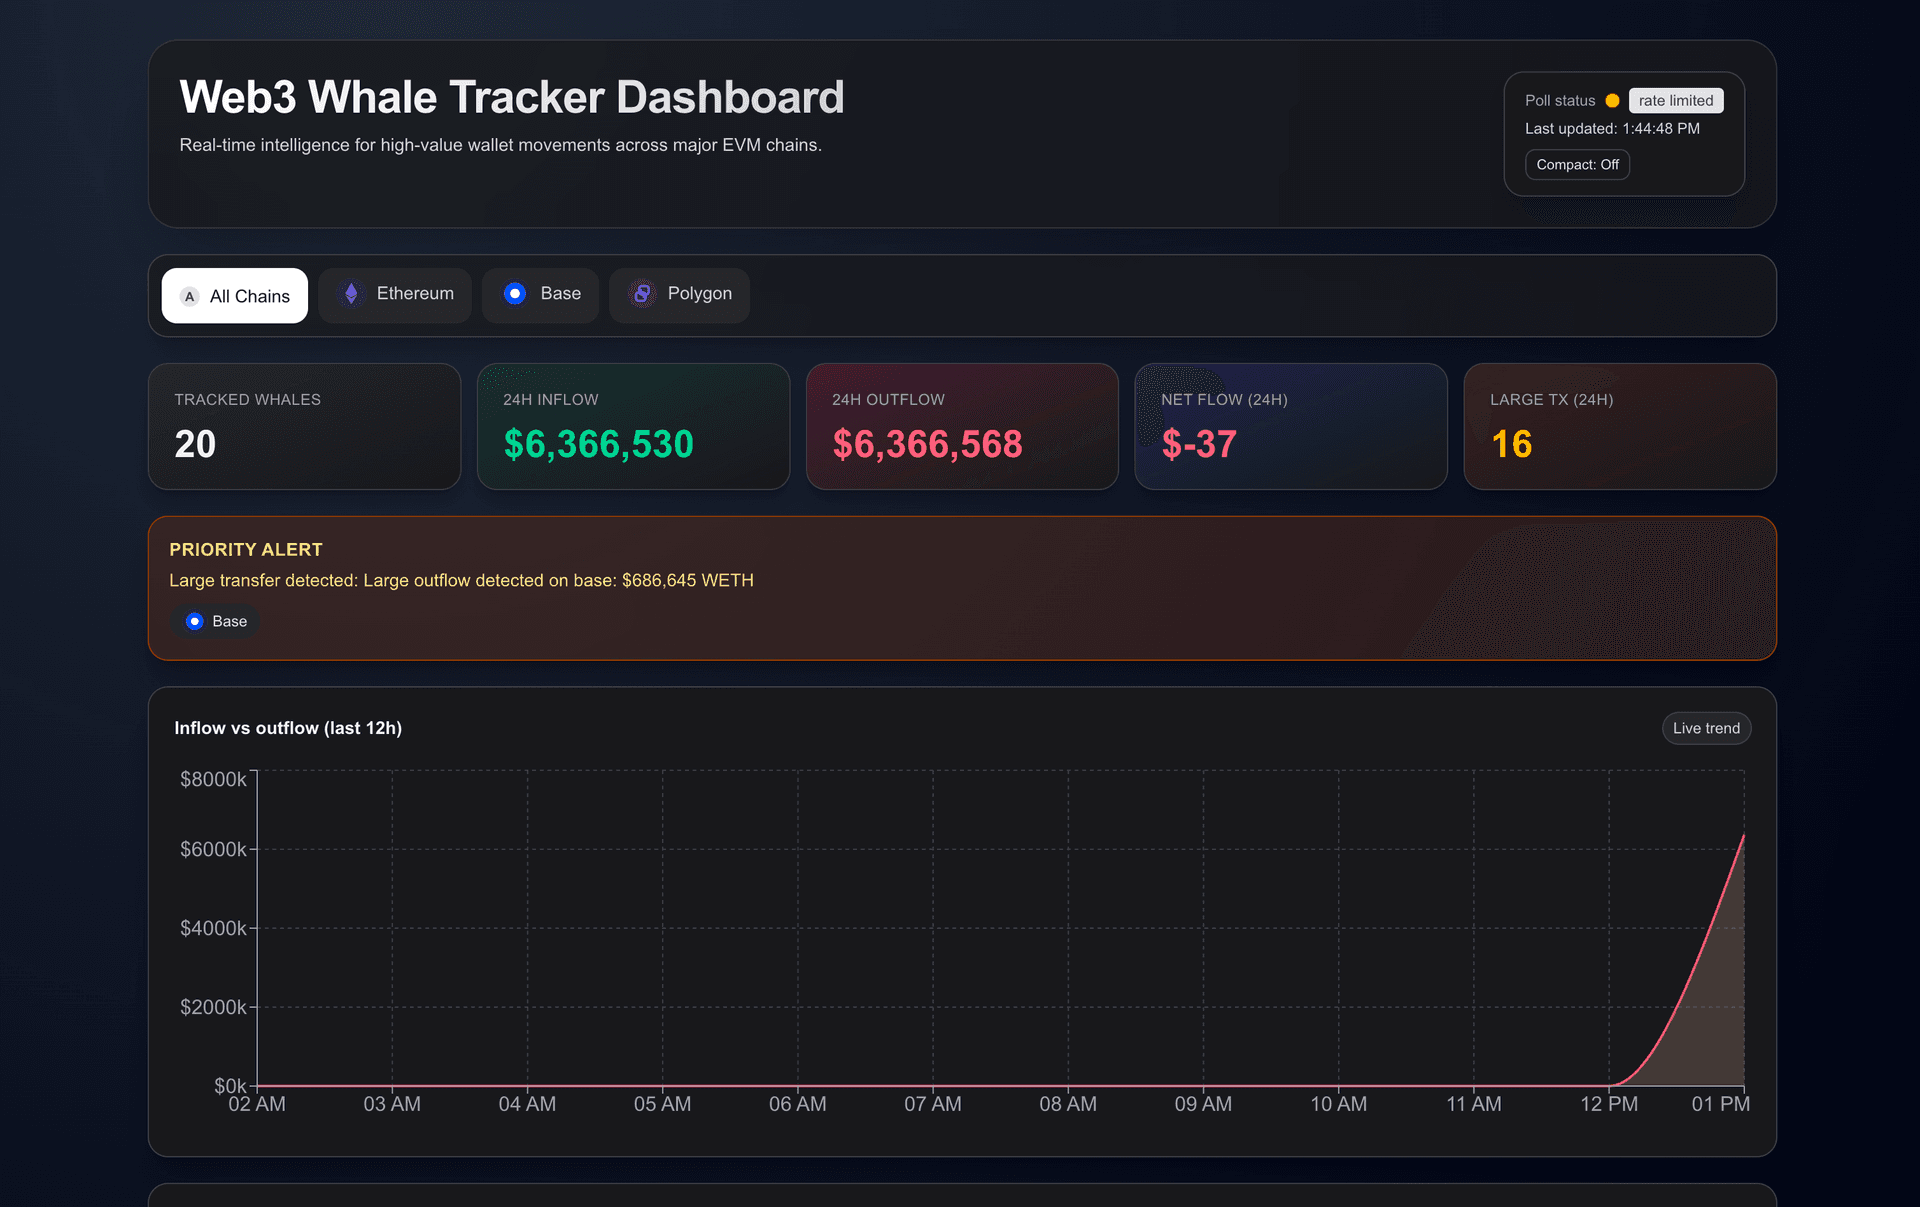
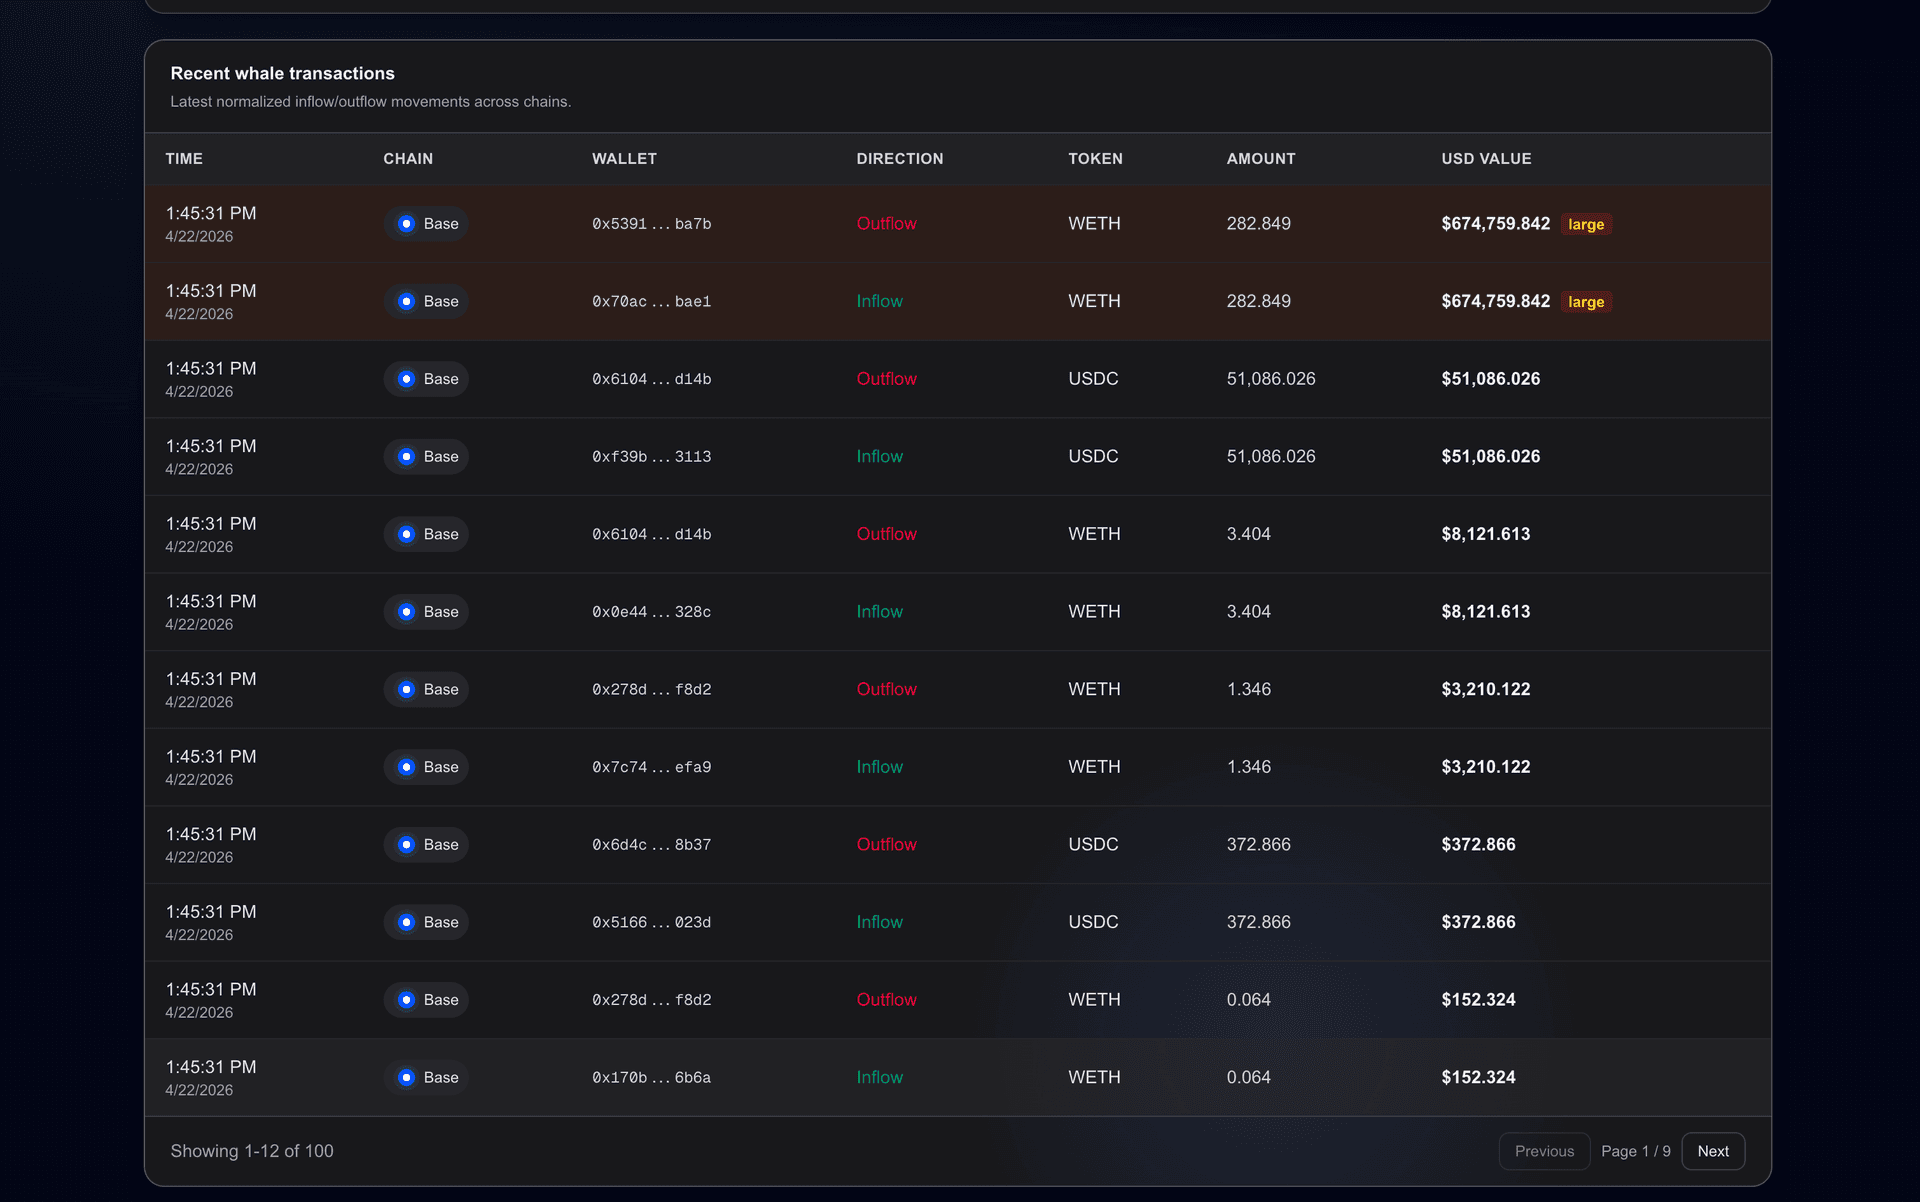
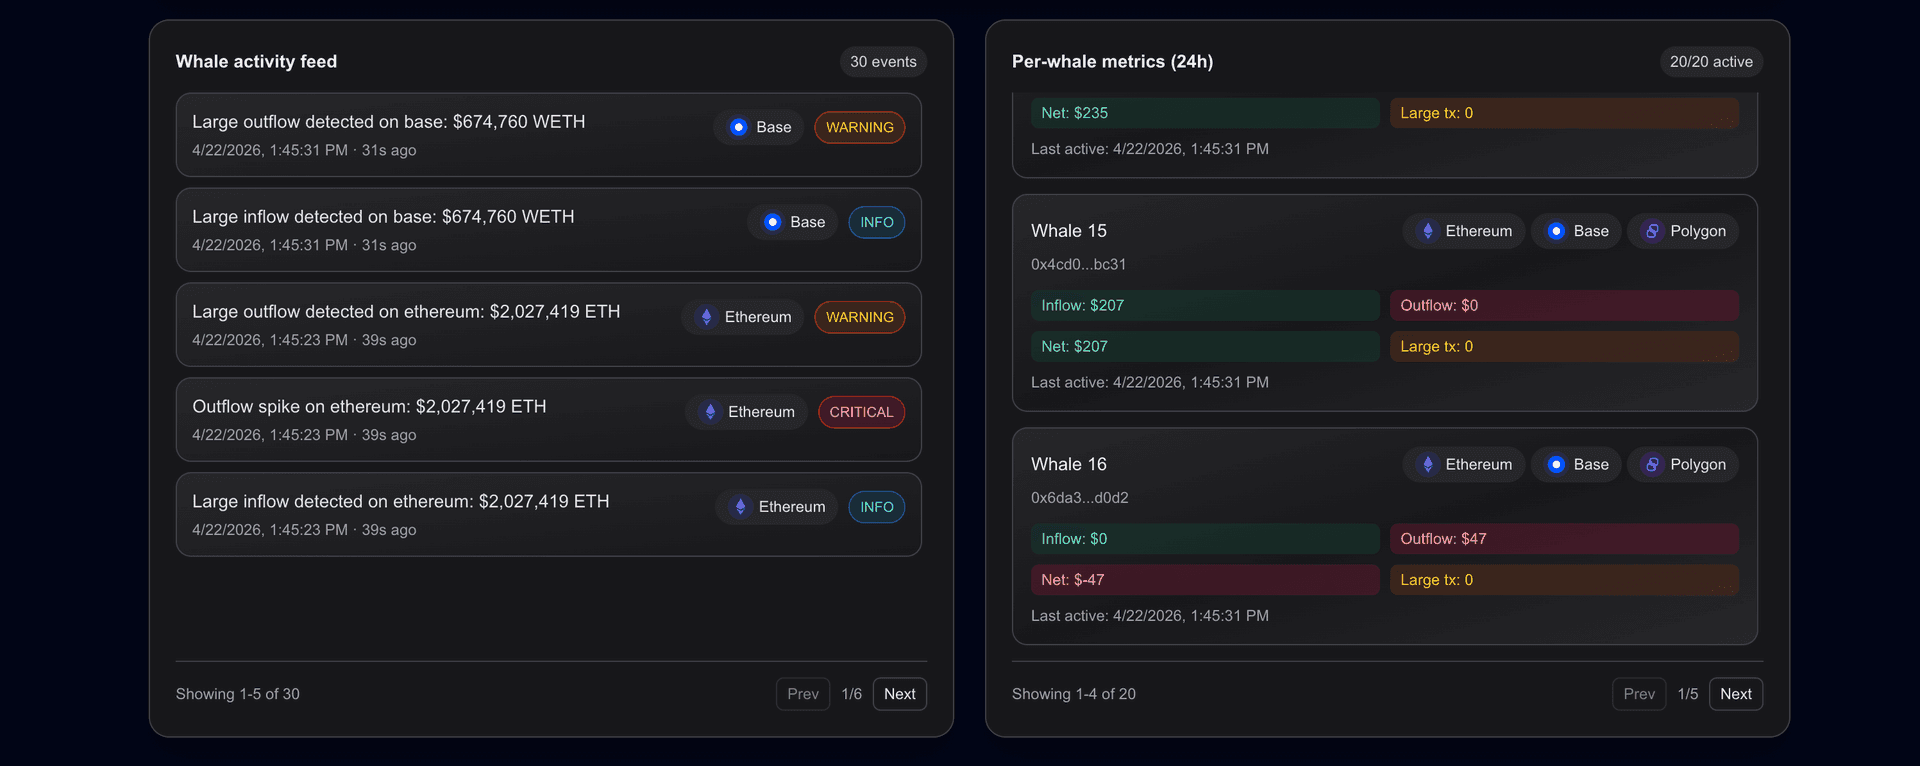
A Web3 whale intelligence dashboard built with Next.js and TypeScript to monitor high-value wallet movements across major EVM chains like Ethereum, Base, and Polygon. Surfaces large inflows and outflows with 24h net flow metrics, a live transaction feed, and per-whale activity breakdowns.
Problem
Tracking large wallet movements across EVM chains requires monitoring multiple explorers and feeds manually to spot significant inflows and outflows.
Solution
Built a multi-chain whale tracker dashboard that surfaces high-value wallet activity, net flow metrics, and a live transaction feed across Ethereum, Base, Polygon, and other EVM chains.
My role
Sole frontend developer — dashboard UI, on-chain data integration, charts, and multi-chain filtering.
Key features
- Multi-chain whale activity monitoring
- 24h net flow metrics and live transaction feed
- Per-whale activity breakdowns
- Moralis and Viem for on-chain data
- Filterable Recharts visualizations
Results & impact
Replaces manual block explorer checks with a single dashboard for spotting significant wallet transfers and whale behavior across EVM chains.
Technology stack
- Viem
- Moralis
- Recharts
- TypeScript
Screenshots
Related projects
Web3 Wallet Transaction Analyzer
Multi-chain Web3 wallet transaction analyzer with real-time insights, inflow/outflow tracking, and wallet behavior analysis built with Next.js, TypeScript, and Moralis.
AI Web3 Wallet Assistant
An AI-powered analytics tool that lets users paste any wallet address and ask questions in plain English. Pulls on-chain transaction data, runs it through an AI model, and returns clear summaries of wallet behavior, risk signals, and activity patterns — making Etherscan accessible to non-technical users.
Real-Time Crypto Price Dashboard
A production-ready crypto analytics dashboard with live price updates, smooth chart rendering, and a premium UI. Built for speed — no layout jank, no loading delays, real data from CoinGecko API.
Related articles
Polling vs Caching vs Real-Time Updates in Web3 Dashboards
When to poll, when to cache, and when to use WebSockets for on-chain data. Trade-offs between speed, cost, and accuracy with practical examples using RPCs, The Graph, and TanStack Query.
Web3PerformanceReact QueryHow to Build a Token Analytics Dashboard for Web3 Projects
Build a token analytics dashboard with price charts, holder tables, and transaction feeds. Data sources, Next.js architecture, and performance tips with TypeScript code examples.
Web3AnalyticsNext.jsCommon Web3 Frontend Development Mistakes and How to Avoid Them
The most common Web3 frontend bugs: poor wallet error handling, over-fetching RPC data, weak loading states, wrong network handling, and bad mobile UX. Practical fixes with code examples.
Web3FrontendUX
Related services
Need a Web3 dashboard or frontend like this?
I build production-ready Web3 dashboards, DeFi interfaces, and analytics frontends with Next.js, TypeScript, and Tailwind CSS.